This site uses cookies to improve your experience. To help us insure we adhere to various privacy regulations, please select your country/region of residence. If you do not select a country, we will assume you are from the United States. Select your Cookie Settings or view our Privacy Policy and Terms of Use.
Cookie Settings
Cookies and similar technologies are used on this website for proper function of the website, for tracking performance analytics and for marketing purposes. We and some of our third-party providers may use cookie data for various purposes. Please review the cookie settings below and choose your preference.
Used for the proper function of the website
Used for monitoring website traffic and interactions
Cookie Settings
Cookies and similar technologies are used on this website for proper function of the website, for tracking performance analytics and for marketing purposes. We and some of our third-party providers may use cookie data for various purposes. Please review the cookie settings below and choose your preference.
Strictly Necessary: Used for the proper function of the website
Performance/Analytics: Used for monitoring website traffic and interactions
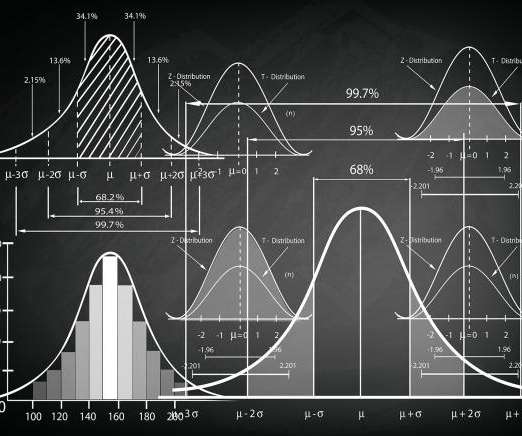
ArticleVideo Book This article was published as a part of the Data Science Blogathon Let us see a short intro about this blog, Descriptive Statistics. The post Descriptive statistics | A Beginners Guide! appeared first on Analytics Vidhya.
One such module is the statistics module, which provides a comprehensive set of functions for statistical operations. Introduction Python is a powerful programming language that offers a wide range of modules for various applications.
Introduction Data science is a rapidly growing field that combines programming, statistics, and domain expertise to extract insights and knowledge from data. Many resources are available for learning data science, including online courses, textbooks, and blogs.
Introduction In this blog post, I will summarise graph data science and how simple python commands can get a lot of interesting and excellent insights and statistics. This article was published as a part of the Data Science Blogathon. It has become one of the hottest areas to research in data science and machine learning […].
Bureau of Labor Statistics predicts that the employment of data scientists will grow 36 percent by 2031, 1 much faster than the average for all occupations. With a goal to help data science teams learn about the application of AI and ML, DataRobot shares helpful, educational blogs based on work with the world’s most strategic companies.
Topics include Prompt Engineering, LlamaIndex, QA systems, ChatGPT in Python, and Excel for Statistics. This blog post introduces the series, covering various subjects in data science and its applications across industries. Introduction Join upcoming DataHour sessions for valuable insights and knowledge on data-tech careers.
This blog dives into the remarkable journey of a data team that achieved unparalleled efficiency using DataOps principles and software that transformed their analytics and data teams into a hyper-efficient powerhouse. The managers of this project were able to hit that sweet spot.
Introduction Data science is a rapidly growing field that combines programming, statistics, and domain expertise to extract insights and knowledge from data. Many resources are available for learning data science, including online courses, textbooks, and blogs. It has various applications in finance, healthcare, and e-commerce.
Statistics can be tremendously beneficial for data scientists, both those that are new to the field and those who have been practicing for a number of years. While many data scientists do not have formal training in statistics, having a foundation of the basics can be critical.
Introduction Data science is a rapidly growing field that combines programming, statistics, and domain expertise to extract insights and knowledge from data. Many resources are available for learning data science, including online courses, textbooks, and blogs. It has various applications in finance, healthcare, and e-commerce.
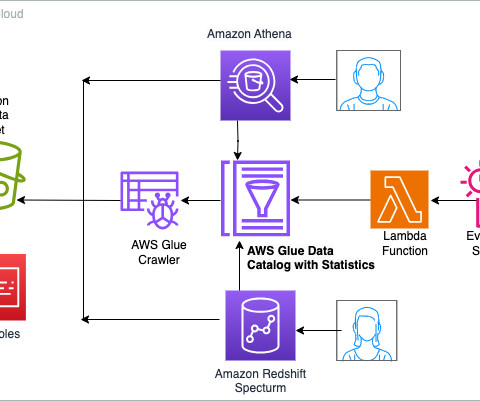
Today, we’re making available a new capability of AWS Glue Data Catalog that allows generating column-level statistics for AWS Glue tables. These statistics are now integrated with the cost-based optimizers (CBO) of Amazon Athena and Amazon Redshift Spectrum , resulting in improved query performance and potential cost savings.
— Thank you to Ann Emery, Depict Data Studio, and her Simple Spreadsheets class for inviting us to talk to them about the use of statistics in nonprofit program evaluation! But then we realized that much of the time, statistics just don’t have much of a role in nonprofit work. Why Nonprofits Shouldn’t Use Statistics.
In this blog post, we discuss the key statistics and prevention measures that can help you better protect your business in 2021. Cyber fraud statistics and preventions that every internet business needs to know to prevent data breaches in 2021. One bad breach and you are potentially risking your business in the hands of hackers.
You’ll want to be mindful of the level of measurement for your different variables, as this will affect the statistical techniques you will be able to apply in your analysis. There are basically 4 types of scales: *Statistics Level Measurement Table*. 5) Which statistical analysis techniques do you want to apply?
A number of optimizations contribute to these speed-ups in performance, including integration with AWS Glue Data Catalog statistics, improved data and metadata filtering, dynamic partition elimination, faster/parallel processing of Iceberg manifest files, and scanner improvements.
Full disclosure: some images have been edited to remove ads or to shorten the scrolling in this blog post. In June of 2020, CRN featured DataKitchen’s DataOps Platform for its ability to manage the data pipeline end-to-end combining concepts from Agile development, DevOps, and statistical process control: DataKitchen.
There are excellent summaries of these failures in Ben Thompson’s newsletter Stratechery and Simon Willison’s blog. Remember that these tools aren’t doing math, they’re just doing statistics on a huge body of text. Of course, Bard and Sydney are beta releases that aren’t open to the wider public yet.
This blog post will explore how zero-ETL capabilities combined with its new application connectors are transforming the way businesses integrate and analyze their data from popular platforms such as ServiceNow, Salesforce, Zendesk, SAP and others. Highlighted in the following screenshot in IngestionTableStatistics are the statistics.
Conduct statistical analysis. One of the most pivotal types of data analysis methods is statistical analysis. Regression: A definitive set of statistical processes centered on estimating the relationships among particular variables to gain a deeper understanding of particular trends or patterns. Conduct statistical analysis.
By Wansink’s own admission in the blog post, that’s not what happened in his lab.” So when you’re missing data or have “low-quality data,” you use assumptions, statistics, and inference to repair your data. HoloClean performs this automatically in a principled, statistical manner.
To fully leverage the power of data science, scientists often need to obtain skills in databases, statistical programming tools, and data visualizations. It helps to automate and makes the usage of the R programming statistical language easier and much more effective. perfect for statistical computing and design.
You can find my results on my Medium blog site. It is merely a very large statistical model that provides the most likely sequence of words in response to a prompt. Oh, by the way, I asked the generative AI at Stable Diffusion to create some images to go with my short story (which you can find on my Medium blog ). Guess what?
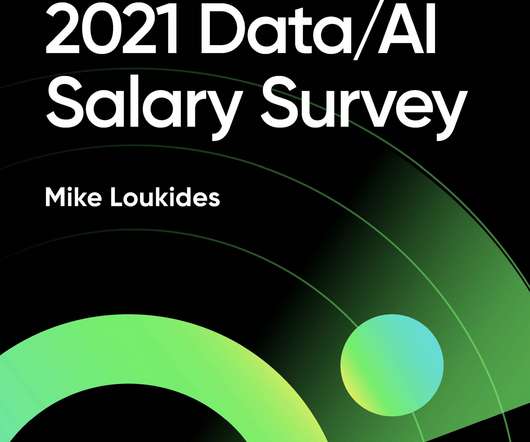
64% of the respondents took part in training or obtained certifications in the past year, and 31% reported spending over 100 hours in training programs, ranging from formal graduate degrees to reading blog posts. Average salary by tools for statistics or machine learning. Salaries by Tool and Platform. Is Spark a tool or a platform?
Now a popular classic, Authors Chris Bergh (CEO), Gil Benghiat (VP Product), and Eran Strod (Marketing Content Manager) of DataKitchen , a DataOps software and services provider ( and full disclosure: the company writing this blog post ), take you through understanding DataOps, its century-long evolution from pioneers like W.
Introduction In this blog post, we will explore the Decoder-Only Transformer architecture, which is a variation of the Transformer model primarily used for tasks like language translation and text generation.
We’ve gathered some interesting data security statistics to give you insight into industry trends, help you determine your own security posture (at least relative to peers), and offer data points to help you advocate for cloud-native data security in your own organization.
This blog covers non-technical, Python, SQL, statistics, data analysis, and machine learning questions. Learn about the most common questions asked during data science interviews.
Introduction Welcome to our comprehensive data analysis blog that delves deep into the world of Netflix. As one of the leading streaming platforms globally, Netflix has revolutionized how we consume entertainment. With its vast library of movies and TV shows, it offers an abundance of choices for viewers around the world.
While some experts try to underline that BA focuses, also, on predictive modeling and advanced statistics to evaluate what will happen in the future, BI is more focused on the present moment of data, making the decision based on current insights. But let’s see in more detail what experts say and how can we connect and differentiate the both.
But often that’s how we present statistics: we just show the notes, we don’t play the music.” – Hans Rosling, Swedish statistician. 14) “Visualize This: The Flowing Data Guide to Design, Visualization, and Statistics” by Nathan Yau. “Most of us need to listen to the music to understand how beautiful it is.
According to the US Bureau of Labor Statistics, demand for qualified business intelligence analysts and managers is expected to soar to 14% by 2026, with the overall need for data professionals to climb to 28% by the same year. The Bureau of Labor Statistics also states that in 2015, the annual median salary for BI analysts was $81,320.
One surprising statistic from the Rand Corporation is that 80% of artificial intelligence (AI). appeared first on Data Management Blog - Data Integration and Modern Data Management Articles, Analysis and Information. The post How Do You Know When You’re Ready for AI?
ArticleVideo Book This article was published as a part of the Data Science Blogathon Introduction This is Part-3 of the 4-part blog series on Bayesian Decision. The post Bayesian Decision Theory – Discriminant Functions and Normal Density(Part 3) appeared first on Analytics Vidhya.
You can read this blog to learn more about how Identity-centered Security better protects customer data while increasing organizational efficiency. Want innovation without disruption? Register to attend Avaya Engage 2023 this June to learn what Avaya Experience Platform can do for your business.
Statistical methods for analyzing this two-dimensional data exist. This statistical test is correct because the data are (presumably) bivariate normal. When there are many variables the Curse of Dimensionality changes the behavior of data and standard statistical methods give the wrong answers. Data Has Properties.
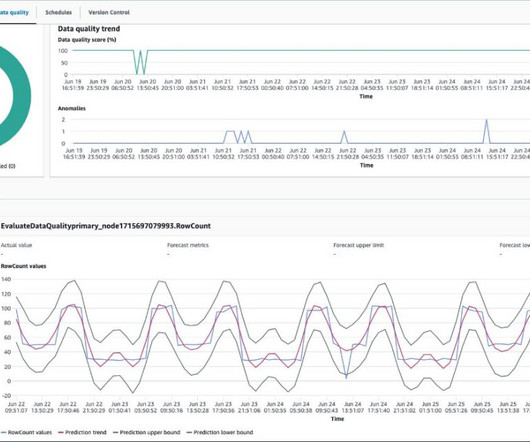
For completeness and ease of navigation, you can explore all the following AWS Glue Data Quality blog posts. Run the job for 6 days and explore how AWS Glue Data Quality learns from data statistics and detects anomalies. When the stack is complete, copy the AWS Glue script to the S3 bucket anomaly-detection-blog- -.
Recent statistics suggest that as much as 20% of employees churn within the first 45 days of employment, but on the flip side, a great onboarding experience ensures 69% of employees stick with a company for three years. When she is not writing or editing, she spends time reading books, cooking and traveling.
As Zoya pointed out in her opening remarks, women in technology are not just a statistic and we should be doing everything we can to flip prevailing assumptions to demonstrate that it’s not women in technology, instead, it is just people in technology who happen to be women. But, it’s about much more than a number.
ArticleVideo Book This article was published as a part of the Data Science Blogathon Introduction This is Part-2 of the 4-part blog series on Bayesian. The post Detailed Guide To Bayesian Decision Theory – Part 2 appeared first on Analytics Vidhya.
Here, we broaden our meaning of “bias” to go beyond model bias, which has the technical statistical meaning of “underfitting”, which essentially means that there is more information and structure in the data than our model has captured.
This feature is part of the Amazon Redshift console and provides a visual and graphical representation of the query’s run order, execution plan, and various statistics. We demonstrated a step-by-step approach to analyze query performance by examining the query execution plan and statistics and identifying the root cause of query slowness.
The demand for real-time online data analysis tools is increasing and the arrival of the IoT (Internet of Things) is also bringing an uncountable amount of data, which will promote the statistical analysis and management at the top of the priorities list. Prescriptive analytics goes a step further into the future. And it’s completely free!
From these developments, data science was born (or at least, it evolved in a huge way) – a discipline where hacking skills and statistics meet niche expertise. Quantitative data analysis focuses on numbers and statistics. Qualitative data analysis is based on observation rather than measurement.
We organize all of the trending information in your field so you don't have to. Join 42,000+ users and stay up to date on the latest articles your peers are reading.
You know about us, now we want to get to know you!
Let's personalize your content
Let's get even more personalized
We recognize your account from another site in our network, please click 'Send Email' below to continue with verifying your account and setting a password.


Let's personalize your content