This site uses cookies to improve your experience. To help us insure we adhere to various privacy regulations, please select your country/region of residence. If you do not select a country, we will assume you are from the United States. Select your Cookie Settings or view our Privacy Policy and Terms of Use.
Cookie Settings
Cookies and similar technologies are used on this website for proper function of the website, for tracking performance analytics and for marketing purposes. We and some of our third-party providers may use cookie data for various purposes. Please review the cookie settings below and choose your preference.
Used for the proper function of the website
Used for monitoring website traffic and interactions
Cookie Settings
Cookies and similar technologies are used on this website for proper function of the website, for tracking performance analytics and for marketing purposes. We and some of our third-party providers may use cookie data for various purposes. Please review the cookie settings below and choose your preference.
Strictly Necessary: Used for the proper function of the website
Performance/Analytics: Used for monitoring website traffic and interactions
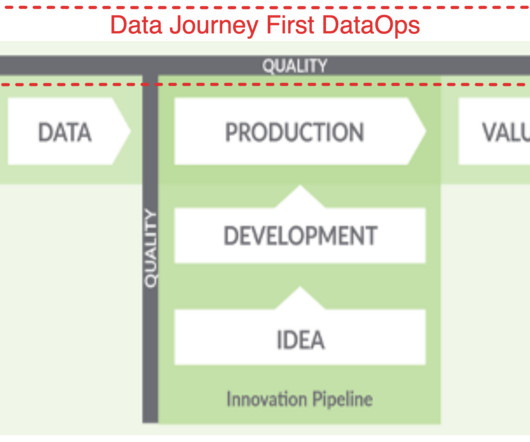
The Race For Data Quality In A Medallion Architecture The Medallion architecture pattern is gaining traction among data teams. It is a layered approach to managing and transforming data. By systematically moving data through these layers, the Medallion architecture enhances the data structure in a data lakehouse environment.
We live in a world of data: there’s more of it than ever before, in a ceaselessly expanding array of forms and locations. Dealing with Data is your window into the ways organizations tackle the challenges of this new world to help their companies and their customers thrive. Understanding how data becomes insights.
“Without big data, you are blind and deaf and in the middle of a freeway.” – Geoffrey Moore, management consultant, and author. In a world dominated by data, it’s more important than ever for businesses to understand how to extract every drop of value from the raft of digital insights available at their fingertips.
“The goal is to turn data into information, and information into insight.” – Carly Fiorina, former executive, president, HP. Digital data is all around us. quintillion bytes of data every single day, with 90% of the world’s digital insights generated in the last two years alone, according to Forbes.
Management reporting is a source of business intelligence that helps business leaders make more accurate, data-driven decisions. In this blog post, we’re going to give a bit of background and context about management reports, and then we’re going to outline 10 essential best practices you can use to make sure your reports are effective.
A Name That Matches the Moment For years, Clouderas platform has helped the worlds most innovative organizations turn data into action. As the AI landscape evolves from experiments into strategic, enterprise-wide initiatives, its clear that our naming should reflect that shift. This isnt just a new label or even AI washing.
2) When & When Not To Use Tables 4) Types Of Table Charts 5) How To Make A Table Chart 6) Table Graph Examples Visual representations of data are all around us. Every day, we see companies, news outlets, researchers, analysts, and more, use graphs and charts to convey information and extract conclusions from it.
Bridging the Gap: How ‘Data in Place’ and ‘Data in Use’ Define Complete Data Observability In a world where 97% of data engineers report burnout and crisis mode seems to be the default setting for data teams, a Zen-like calm feels like an unattainable dream. What is Data in Place?
Does data excite, inspire, or even amaze you? Despite these findings, the undeniable value of intelligence for business, and the incredible demand for BI skills, there is a severe shortage of BI-based data professionals – with a shortfall of 1.5 Table of Contents. 1) Why Shift To A BI Career? 2) Top 10 Necessary BI Skills.
4) How to Select Your KPIs 5) Avoid These KPI Mistakes 6) How To Choose A KPI Management Solution 7) KPI Management Examples Fact: 100% of statistics strategically placed at the top of blog posts are a direct result of people studying the dynamics of Key Performance Indicators, or KPIs. 3) What Are KPI Best Practices? What Is KPI Management?
In May 2021 at the CDO & Data Leaders Global Summit, DataKitchen sat down with the following data leaders to learn how to use DataOps to drive agility and business value. Kurt Zimmer, Head of Data Engineering for Data Enablement at AstraZeneca. Jim Tyo, Chief Data Officer, Invesco. Data takes a long journey.
A DataOps Engineer owns the assembly line that’s used to build a data and analytic product. We find it helpful to think of data operations as a factory. Most organizations run the data factory using manual labor. Too many data organizations run data operations like a hundred-year-old car factory.
Most of what is written though has to do with the enabling technology platforms (cloud or edge or point solutions like data warehouses) or use cases that are driving these benefits (predictive analytics applied to preventive maintenance, financial institution’s fraud detection, or predictive health monitoring as examples) not the underlying data.
The Five Use Cases in Data Observability: Mastering Data Production (#3) Introduction Managing the production phase of data analytics is a daunting challenge. Overseeing multi-tool, multi-dataset, and multi-hop data processes ensures high-quality outputs.
Every day, we encounter graphical representations of data in our jobs and also in the news or advertisements. That being said, for data visualizations to be successful and avoid misleading your audience, it is necessary to understand the different use cases for each visual. What Is A Line Graph?
DataJourney First DataOps Putting Problems in Your Data Estate at the Forefront Welcome to the high-octane world of DataOps, a powerhouse that turbocharges data analytics development and management. But as we navigate ever-evolving seas of data, it’s high time we reset our course.
Its data visualizations provide easily digestible insights into your business via robust, interactive dashboards. We’re lovers of all things data, and blogs about Power BI are no exception. Our Top 10 Power BI Blog Recommendations. Brett Powell’s Data & Analytics Blog. Why it’s Awesome.
This is part 2 in this blog series. You can read part 1, here: Digital Transformation is a DataJourneyFrom Edge to Insight. The first blog introduced a mock connected vehicle manufacturing company, The Electric Car Company (ECC), to illustrate the manufacturing data path through the data lifecycle.
At Juice, we’ve helped our clients launch dozens of data products that generate new revenue streams, differentiate their solutions in the market and build stronger customer relationships. In this series I’ll take you through what you need to know to design, build, launch, sell and support a data product.
2) Charts And Graphs Categories 3) 20 Different Types Of Graphs And Charts 4) How To Choose The Right Chart Type Data and statistics are all around us. That is because graphical representations of data make it easier to convey important information to different audiences. Let’s start this journey by looking at a definition.
The Ten Standard Tools To Develop Data Pipelines In Microsoft Azure. While working in Azure with our customers, we have noticed several standard Azure tools people use to develop data pipelines and ETL or ELT processes. We counted ten ‘standard’ ways to transform and set up batch data pipelines in Microsoft Azure.
Customers of all sizes and industries use Amazon Simple Storage Service (Amazon S3) to store data globally for a variety of use cases. Customers want to know how their data is being accessed, when it is being accessed, and who is accessing it. With exponential growth in data volume, centralized monitoring becomes challenging.
How to measure your data analytics team? So it’s Monday, and you lead a data analytics team of perhaps 30 people. Like most leaders of data analytic teams, you have been doing very little to quantify your team’s success. What should be in that report about your data team? Introduction. You’ve got a new boss.
Data lakes are centralized repositories that can store all structured and unstructured data at any desired scale. The power of the data lake lies in the fact that it often is a cost-effective way to store data. The power of the data lake lies in the fact that it often is a cost-effective way to store data.
Data Teams and Their Types of DataJourneys In the rapidly evolving landscape of data management and analytics, data teams face various challenges ranging fromdata ingestion to end-to-end observability. It explores why DataKitchen’s ‘DataJourneys’ capability can solve these challenges.
Data is the New Oil” was coined by The Economist in May 2017 and became a mantra for organizations to drive new wealth fromdata. But in reality, data by itself has no value. The rapid growth of data volumes has effectively outstripped our ability to process and analyze it.
In today’s digital world, data is generated by a large number of disparate sources and growing at an exponential rate. Companies are faced with the daunting task of ingesting all this data, cleansing it, and using it to provide outstanding customer experience. It’s commonly referred to as a data harmonization or deduplication problem.
Enterprises are moving computing resources closer to where data is created, making edge locations ideal for not only collecting and aggregating local data but also for consuming it as input for generative processes. The rise of edge computing Edge computing has emerged as a strategic paradigm shift in the world of data processing.
Some but not all have stemmed from the pandemic. . In summary, predicting future supply chain demands using last year’s data, just doesn’t work. January 2020 is a distant memory, but for most, the early days of the pandemic was a time that will be ingrained in memories for decades, if not generations.
We’ve read many predictions for 2023 in the data field: they cover excellent topics like data mesh, observability, governance, lakehouses, LLMs, etc. What will the world of data tools be like at the end of 2025? Central IT Data Teams focus on standards, compliance, and cost reduction. Recession: the party is over.
Modern dashboard software makes it simpler than ever to merge and visualize data in a way that’s as inspiring as it is accessible. Knowing who your audience is will help you to determine what data you need. Knowing what story you want to tell (analyzing the data) tells you which data visualization type to use.
In 2023, the IBM® Institute for Business Value (IBV) surveyed 2,500 global executives and found that best-in-class companies are reaping a 13% ROI from their AI projects—more than twice the average ROI of 5.9%. Non-symbolic AI can be useful for transforming unstructured data into organized, meaningful information.
Data has never been more readily accessible. A BI dashboard — or business intelligence dashboard — is an information management tool that uses data visualization to display KPIs (key performance indicators) tracked by a business to assess various aspects of performance while generating actionable insights.
In today’s data-driven world, the ability to effortlessly move and analyze data across diverse platforms is essential. Amazon AppFlow , a fully managed data integration service, has been at the forefront of streamlining data transfer between AWS services, software as a service (SaaS) applications, and now Google BigQuery.
We’re living in the age of real-time data and insights, driven by low-latency data streaming applications. The volume of time-sensitive data produced is increasing rapidly, with different formats of data being introduced across new businesses and customer use cases.
In this blog, we discuss these changes and their implications for successful operations. The customer’s decision-making process is essentially determined by digital information (content) provided directly by the company itself, but also about the company from third parties. The evolution of marketing data.
You can’t talk about data analytics without talking about data modeling. The reasons for this are simple: Before you can start analyzing data, huge datasets like data lakes must be modeled or transformed to be usable. Building the right data model is an important part of your data strategy. Discover why.
This blog post is co-written with Raj Samineni from ATPCO. In today’s data-driven world, companies across industries recognize the immense value of data in making decisions, driving innovation, and building new products to serve their customers.
We live in a world of data: There’s more of it than ever before, in a ceaselessly expanding array of forms and locations. Dealing with Data is your window into the ways data teams are tackling the challenges of this new world to help their companies and their customers thrive. What is data integrity? Data integrity risks.
The magic behind Uber’s data-driven success Uber, the ride-hailing giant, is a household name worldwide. But what most people don’t realize is that behind the scenes, Uber is not just a transportation service; it’s a data and analytics powerhouse. But the simplicity ends there. Every transaction, every cent matters.
Cloudera Contributor: Mark Ramsey, PhD ~ Globally Recognized Chief Data Officer. July brings summer vacations, holiday gatherings, and for the first time in two years, the return of the Massachusetts Institute of Technology (MIT) Chief Data Officer symposium as an in-person event. Luke: What is a modern data platform?
When many businesses start their journey into ML and AI, it’s common to place a lot of energy and focus on the coding and data science algorithms themselves. Accelerating the Full Machine Learning Lifecycle With Cloudera Data Platform. Accelerating the Full Machine Learning Lifecycle With Cloudera Data Platform.
As threats materialize on multiple fronts, organizations must reduce the time frominsight to action.” ” 1 Business and data analysts are intimately familiar with the growing business need for precise, real-time intelligence. Uncertainty is expected and complexity is compounding.
This leaves them grappling to extract meaningful insightsfrom the vast digital footprints they leave behind. Recognizing the need to harness real-time data, businesses are increasingly turning to event-driven architecture (EDA) as a strategic approach to stay ahead of the curve. Do you remember playing in the sandbox as a kid?
We organize all of the trending information in your field so you don't have to. Join 42,000+ users and stay up to date on the latest articles your peers are reading.
You know about us, now we want to get to know you!
Let's personalize your content
Let's get even more personalized
We recognize your account from another site in our network, please click 'Send Email' below to continue with verifying your account and setting a password.
Let's personalize your content