


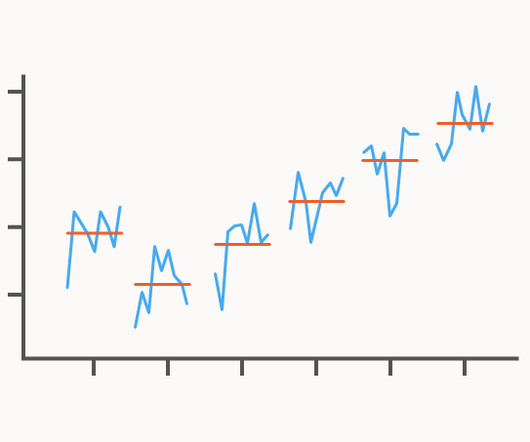
Chart Snapshot: Fan Charts
The Data Visualisation Catalogue
OCTOBER 18, 2024
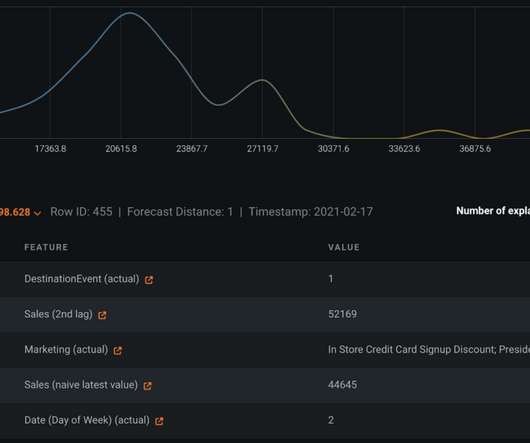
A Fan Chart is a visualisation tool used in time series analysis to display forecasts and associated uncertainties. Fan Charts are therefore useful for illustrating and forecasting the range of possible future changes in the data over time, helping to represent the increasing uncertainty of predictions.


Let's personalize your content