This site uses cookies to improve your experience. To help us insure we adhere to various privacy regulations, please select your country/region of residence. If you do not select a country, we will assume you are from the United States. Select your Cookie Settings or view our Privacy Policy and Terms of Use.
Cookie Settings
Cookies and similar technologies are used on this website for proper function of the website, for tracking performance analytics and for marketing purposes. We and some of our third-party providers may use cookie data for various purposes. Please review the cookie settings below and choose your preference.
Used for the proper function of the website
Used for monitoring website traffic and interactions
Cookie Settings
Cookies and similar technologies are used on this website for proper function of the website, for tracking performance analytics and for marketing purposes. We and some of our third-party providers may use cookie data for various purposes. Please review the cookie settings below and choose your preference.
Strictly Necessary: Used for the proper function of the website
Performance/Analytics: Used for monitoring website traffic and interactions
Operationalreports have the potential to greatly enhance business performance through the utilization of data-driven insights. These reports offer a structured and comprehensible representation of data, enabling a clearer understanding of complex issues that might otherwise remain elusive. What Is An OperationalReport?
The out-of-the-box reporting provided by big ERP vendors frequently fails to address the fundamental requirements of speed and agility, making it difficult for finance and accounting to achieve that vision for up-to-date financial intelligence to support time-critical processes. Limitations of the Oracle ERP Cloud Reporting Tools.
We will be demoing how our range of products can connect to your Cloud or On-Prem Oracle system to deliver Flexible Reporting, Fast Analytics, and Controlled Budgeting Solutions inside Excel and via the Web. Perhaps you would like to book a meeting with us? insightsoftware presents. Account reconciliation is complex.
Consequently, most of them require businesses to provide regular financial reporting and updates concerning their performance relative to those debt agreements. Even worse, your creditors may be entitled to demand repayment in full, leaving your company without the cash it needs to operate. What is a Debt Covenant Report?
With no-code access to real-time data feeds, insightsoftware simplifies, accelerates, and strengthens reporting options for Infor FSM customers directly in Excel RALEIGH, N.C. It grants finance teams more control over Infor FSM reporting and ultimately empowers them to spend less time preparing the data and more time deriving new insights.
But Covid brought about a need for quick-fire decisions, where the rule book had to be re-written overnight or thrown out completely. Companies are awash with information, each different department has their own KPIs and methods of reporting. A changing role and the need for data.
The data products used inside the company include insights from user journeys, operationalreports, and marketing campaign results, among others. It took up to 3 hours to generate daily reporting, which impacted business decision-making when re-calculations needed to happen during the day.
Think of it as trilogy and we’re only in book one. The beginning starts with reporting automation (in a bid to make productivity gains at month-end close and to compress planning cycles). As we make our way to the end book one, robotic process automation becomes the protagonist (automating and speeding-up data entry tasks).
If you’re a reader, chances are good you’ve read a book from Macmillan. For more than 10 years, the publisher has used IBM Cognos Analytics to wrangle its internal and external operationalreporting needs. This encompasses their finance, sales, supply chain, inventory management and production areas.
The great news is, there is a book that can help you “open your mind to Business Intelligence”, reflecting the latest version of Microsoft BI Stack (as at the time of writing). Chapter 1 Which Analysis and Reporting Tools Do You Need? Part III Business Intelligence for Reporting.
The great news is, there is a book that can help you “open your mind to Business Intelligence”, reflecting the latest version of Microsoft BI Stack (as at the time of writing). Chapter 1 Which Analysis and Reporting Tools Do You Need? Part III Business Intelligence for Reporting.
Calculating accurate expected payments The ability to analyze data retrospectively and prospectively from claims reimbursement books to assess the accuracy of your expected payment and supporting data will allow you to minimize claim denials. .
For the accounting department in particular, the ability to collect and collate information, analyze that data, and produce accurate financial and operationalreports quickly has never been more important. When the finance and accounting department can close the books faster, management can see problems earlier and address them sooner.
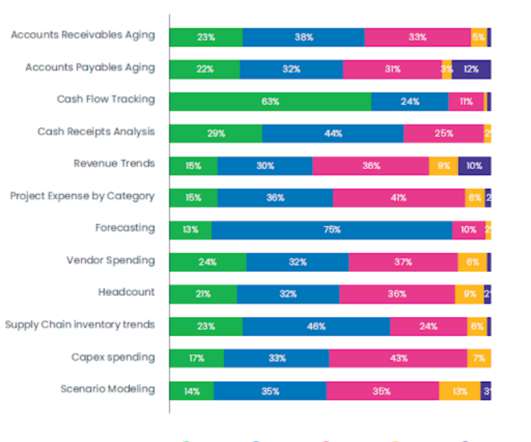
The same can be said for finance teams as they work on operationalreporting. insightsoftware partnered with Hanover Research to discover which tools finance professionals use most for operationalreporting and how they feel about those tools. Only 23 percent are able to produce all the operationalreports required.
As leaders reevaluate the agility and resilience of their organizations, they need accurate, timely operationalreports that provide real insight into the inner workings of their businesses. The task of creating those reports falls onto the shoulders of finance teams that are sometimes already struggling to manage a heavy workload.
Though the software offers several advantages over previous versions, finance teams using Microsoft D365BC may experience some challenges in the areas of operational and financial reporting. One general Microsoft D365BC reporting challenge comes from the ERP’s complex data table structure.
How do you ensure greater efficiency and accuracy for your financial reports? Here are five ways you can improve finance reporting efficiency, backed by our recent research into Oracle-driven finance teams. Embrace Finance Automation Oracle-driven finance teams contend with a wide range of automated financial reporting needs.
While reports are important, many board members aren’t taking the contents of board reports to mind. Having easy-to-read and straightforward board reports is something many companies can work on to forward their vision. How can you help your company get ahead with comprehensive board reporting that hits home?
If you’re relying on JasperReports or Crystal Reports to power your data reporting and insights, you’ve likely heard the news: many popular versions are reaching end-of-life, and it’s time to start planning your next steps. If you’re a Crystal Reports user, the situation is just as pressing.
But generating custom reports requires deep technical knowledge and the process is often managed by IT. The process can often take weeks, if not months, and, in many cases, the report or dashboard is limited to a single use case and applicable only to a single business unit or user – often only the requester. Download Now.
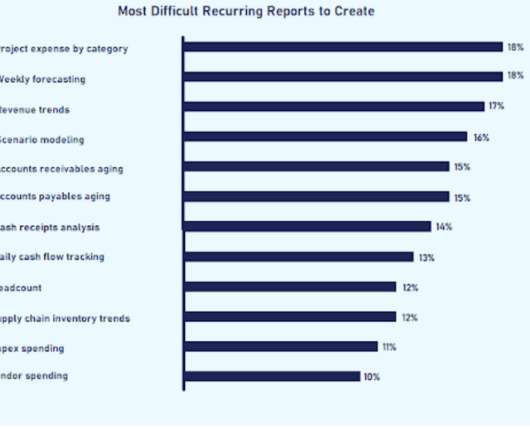
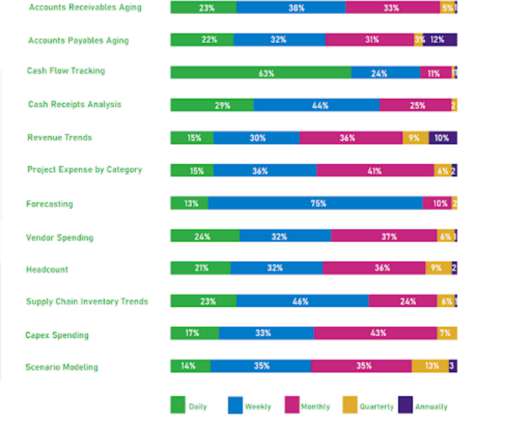
Finance teams are increasingly being asked for timely, recurring operationalreports to support day-to-day decision making. The most common challenges your finance team probably faces are: lengthy report creation time, existing tool complexity, and the inability to drill into transactional data. Download Now.
Enter operationalreporting, the change agent in our story. In the past year alone, a staggering 66% of IT decision-makers have witnessed a surge in requests for operationalreports. Recent findings highlight the increasing importance of operationalreporting and the significant impact it has on organizations.
Modern reporting tools like Tableau and Power BI have transformed how end users visualize and analyze data. Why REST APIs Fall Short in Reporting Workflows REST APIs were designed for lightweight web services, not intensive analytics. Limited BI Integration: Reporting tools like Tableau and Power BI require relational datasets.
As Business Intelligence (BI) tools, data warehousing solutions, and enterprise data and application landscapes have advanced, it’s worth taking the time to rethink that old model, starting with the dichotomy between operationalreporting (OR) and strategic analytics. OperationalReporting: Trends, Challenges, and the Key to Success.
The need to create consolidated reporting and analytics that handle all your Oracle ERP instances is a challenge your enterprise faces in many circumstances, but none as important as during cloud migration. Enhance Your OperationalReporting Needs with Angles for Oracle. Does This Challenge Sound Familiar? Access Resource.
Leverage Real-Time Reporting for Informed Decisions Effective project-based reporting is crucial during migration. Project reporting is a fundamental practice that communicates project statuses, progress, and performance. Top 5 Things to Consider Before Moving to Oracle ERP Cloud Download Now 2.
Eighty-nine percent of financial professionals across multiple geographies and industries are dissatisfied with their operationalreporting tools. What Is OperationalReporting? We queried 500 finance decision-makers across multiple regions and industries to understand the operationalreporting landscape.
That’s where Jet Reports from insightsoftware comes in. Designed to seamlessly integrate with Microsoft Dynamics 365 Business Central (BC), NAV, and GP, Jet Reports empowers finance professionals to build reports and dashboards without needing IT support. Jet Reports delivers the speed and accuracy you demand.
The introduction of post-Brexit trade rules, increasing tariff impact, and the pressure to meet ESG reporting obligations make financial reporting not just a back-office taskbut a core strategic function. Errors in reporting or delays in submission can lead to heavy penalties, reputational damage, and missed investment opportunities.
In the fast-paced world of finance and property management, accurate and timely reporting is crucial. While platforms like Yardi and MRI offer valuable features, some users may find the process of generating detailed reports challenging. You can build out that kind of report fairly easily in Excel.
These changes have introduced a higher level of complexity to financial reporting and disclosure practices, particularly for organizations engaged in cross-border trade with the EU and beyond. Challenges for the UK and Ireland The post-Brexit era has introduced unique reporting pressures for finance teams across the UK and Ireland.
Countries like China, Japan, Singapore, and Australia each bring their own unique set of rules and disclosure requirements, making it difficult for multi-national enterprises to maintain a consistent financial reporting strategy. In a region where high-volume reporting is the norm, Certent also drastically improves production timelines.
Multinational corporations operating in the DACH regionGermany, Austria, and Switzerlandare navigating an increasingly volatile trade landscape, where precise financial reporting is both a necessity and a challenge. Swiss businesses can align with FER standards while maintaining transparency in cross-border operations.
Working in restrictive conditions is tough, especially when your reporting software doesn’t do enough to limit those restraints. Finance teams are regularly tasked with creating operationalreports for their own use or to share with other business areas (departmental expenditure, open invoices, performance against budget).
However, Dynamics users may find that it doesn’t solve their financial reporting challenges – native ERP reports are great for basic reporting but not well-suited to advanced financial reporting. For seamless financial reporting in Excel, investing in a tool like Atlas from insightsoftware bridges the gap.
Working in restrictive conditions is tough, especially when your reporting software doesn’t do enough to limit those restraints. Finance teams are regularly tasked with creating operationalreports for their own use or to share with other business areas (departmental expenditure, open invoices, performance against budget).
How do you navigate the complexity of your project-based financial reporting? Don’t underestimate the power of project reporting. It’s more than just a report–it’s a strategic weapon in your arsenal. This static approach creates a lag between data collection and report generation.
For financial professionals, this isnt just a logistics or procurement challengeits a high-stakes compliance and reporting minefield. Tariff-related costs must be forecasted, modeled, and accurately reflected in financial reports. Dont let tariff complexity derail your reporting strategy. It works within Microsoft Office.
Self-Service Analytics With Vizlib Custom Report Challenge: With growing demands for tailored analytics, how can BI teams keep up with endless requests for customized dashboards without being overwhelmed? By giving users control over what dimensions and measures they view, Vizlibs Custom Report: Reduces dependency on IT teams.
In more layman terms, public sector KPIs serve two important purposes: They report important information to citizens. The constituents cannot hold their government responsible without having access to periodic reporting on key performance metrics. All public entities must be subjected to independent reviews on their operation.
In more layman terms, public sector KPIs serve two important purposes: They report important information to citizens. The constituents cannot hold their government responsible without having access to periodic reporting on key performance metrics. All public entities must be subjected to independent reviews on their operation.
Using the reporting tools ERPs provide can help streamline workflows and reduce timelines, but they’re often too rigid to offer the tailored reporting capabilities organizations need to answer specific business questions. Ultimately, this causes backlogs of requests to pile up, stretching period-end reporting from days to weeks.
Inventory KPIs and metrics are crucial aspects of the reporting process. Why Inventory KPIs and Metrics Are Essential for Reporting? Good reporting allows you to monitor the health of your operation. Here are some of the benefits of using inventory KPIs for reporting: #1. Forecasting is a crucial part of reporting.
Weve seen incredible technological advancements that have produced business and financial reporting tools that streamline processes, create efficiencies, bridge skills gaps, and position organizations to react to an ever-increasing pace of market change with agility and confidence.
We organize all of the trending information in your field so you don't have to. Join 42,000+ users and stay up to date on the latest articles your peers are reading.
You know about us, now we want to get to know you!
Let's personalize your content
Let's get even more personalized
We recognize your account from another site in our network, please click 'Send Email' below to continue with verifying your account and setting a password.


Let's personalize your content