Remove Broadcasting Remove Metrics Remove Optimization
article thumbnail

Optimize checkpointing in your Amazon Managed Service for Apache Flink applications with buffer debloating and unaligned checkpoints – Part 2

AWS Big Data

We’ve already discussed how checkpoints, when triggered by the job manager, signal all source operators to snapshot their state, which is then broadcasted as a special record called a checkpoint barrier. Then it broadcasts the barrier downstream. For more details, refer to Limitations.

article thumbnail

Improve OpenSearch Service cluster resiliency and performance with dedicated coordinator nodes

AWS Big Data

When you send requests to your OpenSearch Service domain, the request is broadcast to the nodes with shards that will process that request. We recommend using CPU optimized instances of a size similar to that of the data nodes. Coordinator metrics While the guidelines above are a good start, every use case is unique.

Metrics 106
Insiders

Sign Up for our Newsletter

This site is protected by reCAPTCHA and the Google Privacy Policy and Terms of Service apply.

article thumbnail

Detect and handle data skew on AWS Glue

AWS Big Data

As a result, a developer may observe that their AWS Glue jobs are completing without apparent errors, yet the system could be operating far from its optimal efficiency. Another thing that you can use is the summary metrics for each stage. You can detect data skew with data analysis or by using the Spark UI.

article thumbnail

Optimize checkpointing in your Amazon Managed Service for Apache Flink applications with buffer debloating and unaligned checkpoints – Part 1

AWS Big Data

Internally, Apache Flink uses clever mechanisms to maintain exactly-once state consistency, while also optimizing for throughput and reduced latency. The time a sub-task spends on the synchronous and asynchronous parts of the checkpoint is measured by Sync Duration and Async Duration metrics, shown by the Apache Flink UI.

article thumbnail

Simplify your query performance diagnostics in Amazon Redshift with Query profiler

AWS Big Data

Amazon Redshift provides performance metrics and data so you can track the health and performance of your provisioned clusters, serverless workgroups, and databases. This will open the query plan in a tree view along with additional metrics on the side panel. For more information, refer to Amazon Redshift clusters.

article thumbnail

The Role of Data Analytics in Football Performance

Smart Data Collective

Today, teams utilize sophisticated tracking systems, video analysis tools, and wearable devices to gather a wide range of performance metrics. In addition to performance metrics, data collection also includes injury and fitness data. However, the advent of advanced technologies and analytics has ushered in a new era of data collection.

article thumbnail

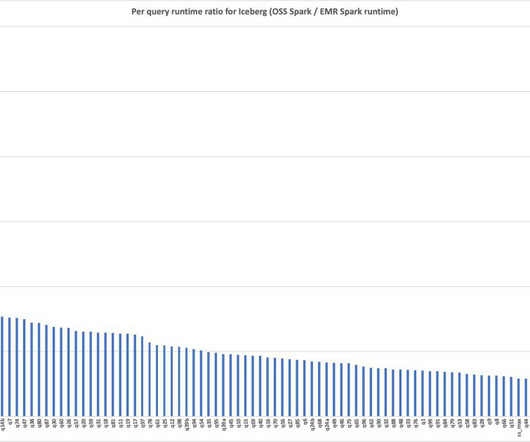
Amazon EMR 7.1 runtime for Apache Spark and Iceberg can run Spark workloads 2.7 times faster than Apache Spark 3.5.1 and Iceberg 1.5.2

AWS Big Data

times faster with Amazon EMR runtime for Apache Spark , we detailed some of the optimizations, showing a runtime improvement of 4.5 However, many of the optimizations are geared towards DataSource V1, whereas Iceberg uses Spark DataSource V2. We have added eight new optimizations incrementally since the Amazon EMR 6.15