This site uses cookies to improve your experience. To help us insure we adhere to various privacy regulations, please select your country/region of residence. If you do not select a country, we will assume you are from the United States. Select your Cookie Settings or view our Privacy Policy and Terms of Use.
Cookie Settings
Cookies and similar technologies are used on this website for proper function of the website, for tracking performance analytics and for marketing purposes. We and some of our third-party providers may use cookie data for various purposes. Please review the cookie settings below and choose your preference.
Used for the proper function of the website
Used for monitoring website traffic and interactions
Cookie Settings
Cookies and similar technologies are used on this website for proper function of the website, for tracking performance analytics and for marketing purposes. We and some of our third-party providers may use cookie data for various purposes. Please review the cookie settings below and choose your preference.
Strictly Necessary: Used for the proper function of the website
Performance/Analytics: Used for monitoring website traffic and interactions
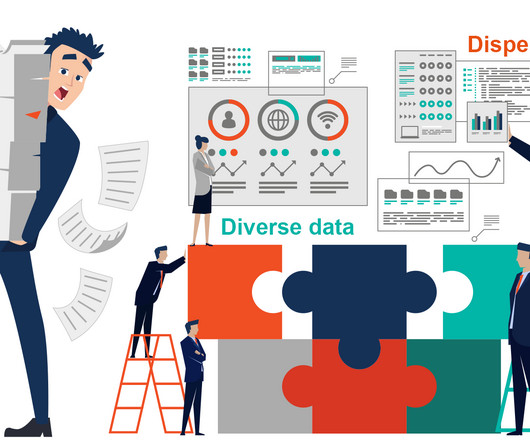
Data overload is a growing problem for enterprisebusinesses. Analysis teams must often work manually to navigate seas of data and generate the specific insights their colleagues request.It can take multiple analysts weeks to gather, integrate and process the data they need.
Despite the similarities in name, there are a number of key differences between an enterprise architecture and solutions architecture. Much like the differences between enterprise architecture (EA) and data architecture, EA’s holistic view of the enterprise will often see enterprise and solution architects collaborate.
Despite the similarities in name, there are a number of key differences between an enterprise architecture and solutions architecture. Much like the differences between enterprise architecture (EA) and data architecture, EA’s holistic view of the enterprise will often see enterprise and solution architects collaborate.
Over 70% of global businesses use some form of analytics. This is an important year for enterprises keeping in view that most global industries are recovering from the pandemic horror, and the era of web 3.0 They are using analytics to help drive business growth. Tools Updating: A business analyst is as good as his/her tools.
According to the PMI Pulse of the Profession report , inaccurate requirements as a result of poor or missing businessanalysis processes are the second leading cause of project failure (39%), the first reason being changes in an organization’s priorities (41%). Developing businessanalysis competency in your organization.
Next, data is processed in the Silver layer , which undergoes “just enough” cleaning and transformation to provide a unified, enterprise-wide view of core business entities. Bronze layers can also be the raw database tables. Bronze layers should be immutable.
In the current data management landscape, enterprises have to deal with diverse and dispersed data at unimaginable volumes. Among this complexity of siloed data and content, valuable business insights and opportunities get lost. The vast amounts of data enterprises have today need to be processed, understood and leveraged in real time.
Successful business analysts have the skills to work with data, the acumen to understand the business side of the organization, and the ability to communicate that information to people outside of IT. And the top employers of business analysts include Google, Citi, JPMorgan Chase & Co., Amazon, Capgemini, and IBM.
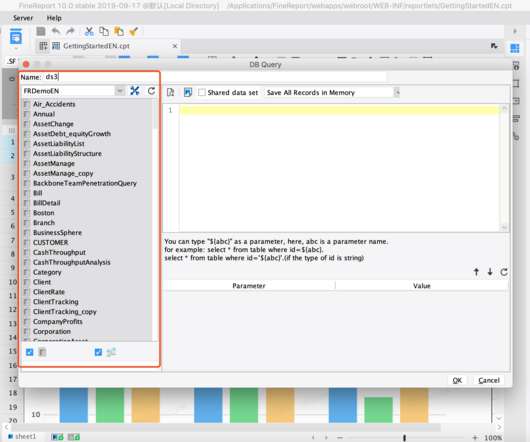
Cost Analysis (by FineReport). BI platform is not only for businessanalysis and strategic decision-making, but also for government departments. For enterprises, it offers a quote-based plan that charges according to the function module and concurrent users. BI platform for Transportation Monitoring. FineReport.
Living in a digital era, foresighted enterprises resort to business intelligence to improve their competitiveness. Among amounts of intelligent choices, business intelligence(BI) dashboard software is an awesome one. Business intelligence dashboard software collects dashboards from different ranges of commercial fields.
This article describes the Spearman’s Rank Correlation and how it is used for enterpriseanalysis. How is Spearman’s Rank Correlation Useful for BusinessAnalysis? Business Problem: An educational organization wants to assess students’ rating, based on two different sources of observation.
To better understand multiple linear regression, let’s look at one such analysis of independent variables: Temperature and Humidity, and a target variable (yield). How Can Multiple Linear Regression Be Helpful for BusinessAnalysis? Use Case – 1. About Smarten.
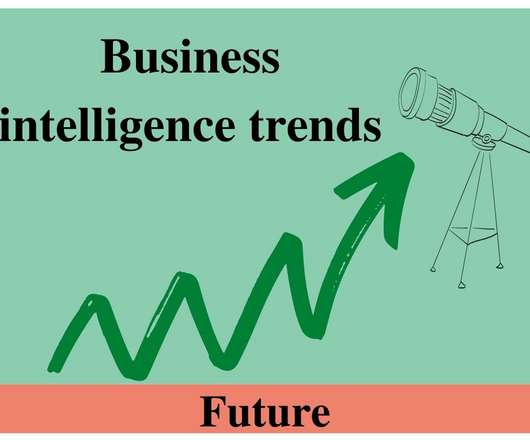
Predictive businessanalysis. Predictive businessanalysis is one of the most important factors for enterprises to use business intelligence nowadays. Prediction of Business Intelligence trends. It will continue to do so in the future as businesses seek much more secure solutions for business data.
Its Azure data lake, dubbed The Global Mosaic Information Center, unifies sales data globally to facilitate more substantive businessanalysis and forecasting instead of basic functional reporting out of each location as had been the case previously.
Among these problems, one is that the third party on market data analysis platform or enterprises’ own platforms have been unable to meet the needs of business development. With the advancement of information construction, enterprises have accumulated massive data base. Data Analysis. INTERFACE OF BI SYSTEM.
Metaverses vs. internal enterprise immersive experiences Experience tells us that waiting for the next big anything that could have tremendous impact on how our customers, employees, and partners relate to our organizations is not a prescription for long-term growth. You can start slow and build in new technology components over time.
GRC certifications validate the skills, knowledge, and abilities IT professionals have to manage governance, risk, and compliance (GRC) in the enterprise. That significant amount of responsibility is critical in today’s business climate, and certification can prove you are up to the task. What are GRC certifications?
Companies may have had highly detailed migration or execution plans, but many failed to develop a point of view on the role of cloud in the enterprise. A cloud strategy should be built on business outcomes the organization is seeking to achieve, which may then align with some of those potential benefits.
That ease of deployment bypasses conventional checks and balances, which means spending decisions are made without alignment to business needs. To address this misalignment, enterprises need a model that provides IT the agility, scalability, and flexibility of the cloud while allowing the business to make value-based decisions overspend.
Exam fee: $225 for members, $300 for non-members Expiration: Does not expire Certified in Governance of Enterprise IT (CGEIT) The ISACA claims IT professionals with a CGEIT certification are among the highest paid, citing an average salary of $141,000.
For most companies, the staffs spend 50% time on data collection, 30% time on checking and approving the data, 15% time on developing and publishing the reports, and 5% on businessanalysis. However, it is evident that the value of data collection for business decisions is minimal, but the value of data analysis is the greatest.
This article looks at the ARIMAX Forecasting method of analysis and how it can be used for businessanalysis. ARIMAX is suitable for analysis where there are additional explanatory variables (multivariate) in categorical and/or numeric format. How Can ARIMAX Forecasting Be Used for EnterpriseAnalysis?
As a part of enterprise informationization, there are many reasons for BI platform to do separate management and disaster recovery. On the one hand, governments, Internet companies, and large enterprises attach great importance to informatization construction and require separate maintenance. Metadata management.
Even with flexible remote work policies, the most seasoned employees in roles such as customer support, data science, businessanalysis, and DevSecOps move on to greener pastures and leave—just when they finally seemed to figure out how everything works.
What are the Advantages of Augmented Analytics and How Can My Business Benefit? Augmented analytics support allows the organization to produce fast, dependable insights and improve the value of businessanalysis across the enterprise. It is hard to overstate the benefits and advantages of advanced analytics.
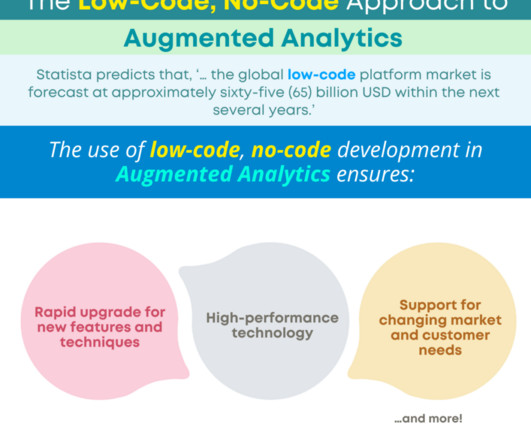
Simply put, Low Code software development allows development of enterprise applications with a minimal need for coding. It enables data sharing and allows the enterprise to produce fast, dependable insights and improve the value of businessanalysis across the enterprise, democratizing the use of advanced analytics.
When we consider the use of LCNC in business intelligence (BI) tools and predictive analytics, the reason for the uptick in usage among developers and IT professionals is quite clear.
Previously, Halford’s IT function was conventionally organized with a structure made up of separate teams for businessanalysis, solutions design, infrastructure, and so on. This is my own personal view here, but most enterprise technical teams are steeped in hierarchical organizations that suffocate way too much of the talent.
Excel is indeed a good reporting tool, and the pivot table function is very easy to use, but it also has two fatal disadvantages: The amount of enterprise data is getting larger and larger, when Excel faces a large amount of data, the corresponding time is too long or it cannot respond. From Neil Patel. Steps are as follows: 1.
Use business objects dashboard, and then these problems won’t surround you anymore. What is business objects dashboard? Business objects dashboard is the collection of reports and charts. Compared with other dashboards, business objects dashboard is more specific and targets to various business fields.
5) Which statistical analysis techniques do you want to apply? There are dozens of statistical analysis techniques that you can use. Whether you are a small business or large enterprise, the data tell its story, and you should be able to listen. 11) How can you create a data-driven culture? Dirty data is costing you.
What it means, among other things, is that businesses that invest in and deploy Augmented Analytics within the enterprise will increase productivity and enable the transformation of business users to Citizen Data Scientists so as to engender and empower the organization at large and each user individually.
With business intelligence(BI) tools play a more critical role in the enterprises, the technology is poised for an oversized effect in the coming year. BI software assists businesses with data display and analytics to help companies discover the situations, market challenges, as well as the chance. FineReport in-depth review.
Candidates need five-plus years of experience in software development, testing, businessanalysis, or product or project management, as well as experience in Scrum. The 45-question exam tests candidates’ ability to: Connect the portfolio to the enterprise. How to adopt a customer-centric mindset. Create portfolio flow.
New technology acumen and foresight: The quick ascent of generative AI has highlighted the importance of establishing effective use cases and demonstrating effective decision-making on adoption of emerging technologies, wherever they might arrive in the enterprise.
This twenty-four (24) article series includes: Naïve Bayes Classification: What is Naïve Bayes Classification and How is it Used for EnterpriseAnalysis? Use Case(s): Weather Forecasting, Fraud Analysis and more. Use Case(s): Market Basket Analysis, Frequently Bundled Products and more.
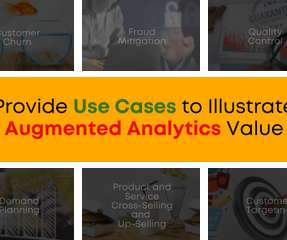
While every business can and should develop a set of business use cases that will apply to its own unique industry, function and/or issues, your enterprise can use these sample use cases to illustrate the usefulness of augmented analytics.’
Self-serve data preparation walks the user through the data preparation process so that they can easily prepare data for analysis without the assistance of IT or a data scientist. Empower users with augmented analytics that include ETL for business users, smart data visualization and more!
With well-designed business dashboards , you will gain lots of benefits to operate your business. Metrics are an important criterion for judging the operation of various departments of an enterprise. Business dashboard highlights various business metrics. Mobile visualization of business dashboard of FineReport.
It enables data sharing and allows the organization to produce fast, dependable insights and improve the value of businessanalysis across the enterprise, thereby democratizing the use of advanced analytics. Augmented Analytics is designed to encourage user empowerment and user adoption.
To enterprises, creating reports for your clients play a necessary role in building a solid, favorable and benign working relationship between two sides. self-service analytics at enterprise scale strong results and meaningful insights reliable data protection. dashboard visualization (by Finereport?.
To build a data-driven business, it is important to democratize enterprise data assets in a data catalog. This post shows you how to integrate Apache Flink in Amazon EMR with the AWS Glue Data Catalog so that you can ingest streaming data in real time and access the data in near-real time for businessanalysis.
As business becomes more competitive, as markets get tighter, there is a need to leverage and optimize your resources to the greatest extent possible. Using the knowledge and skill of each individual on your team and allowing these skills to inform business decisions and businessanalysis is key.
Supply chain business intelligence examples. With the aid of business intelligence, it’s helpful to make businessanalysis and decision. Business intelligence will clearly present market proportion, supply chain distribution and other key indicators with charts and numbers. Take the following figure as an example.
We organize all of the trending information in your field so you don't have to. Join 42,000+ users and stay up to date on the latest articles your peers are reading.
You know about us, now we want to get to know you!
Let's personalize your content
Let's get even more personalized
We recognize your account from another site in our network, please click 'Send Email' below to continue with verifying your account and setting a password.


Let's personalize your content