This site uses cookies to improve your experience. To help us insure we adhere to various privacy regulations, please select your country/region of residence. If you do not select a country, we will assume you are from the United States. Select your Cookie Settings or view our Privacy Policy and Terms of Use.
Cookie Settings
Cookies and similar technologies are used on this website for proper function of the website, for tracking performance analytics and for marketing purposes. We and some of our third-party providers may use cookie data for various purposes. Please review the cookie settings below and choose your preference.
Used for the proper function of the website
Used for monitoring website traffic and interactions
Cookie Settings
Cookies and similar technologies are used on this website for proper function of the website, for tracking performance analytics and for marketing purposes. We and some of our third-party providers may use cookie data for various purposes. Please review the cookie settings below and choose your preference.
Strictly Necessary: Used for the proper function of the website
Performance/Analytics: Used for monitoring website traffic and interactions
Business analysts must rapidly deliver value and simultaneously manage fragile and error-prone analytics production pipelines. Data tables from IT and other data sources require a large amount of repetitive, manual work to be used in analytics. In businessanalytics, fire-fighting and stress are common.
With the growth of business data, it is no longer surprising that AI has penetrated data analytics and business insight tools. Business insight and data analytics landscape. Artificial intelligence and allied technologies make business insight tools and data analytics software more efficient.
What is businessanalytics? Businessanalytics is the practical application of statistical analysis and technologies on business data to identify and anticipate trends and predict business outcomes. The discipline is a key facet of the business analyst role. Businessanalytics techniques.
Over 70% of global businesses use some form of analytics. This is an important year for enterprises keeping in view that most global industries are recovering from the pandemic horror, and the era of web 3.0 They are using analytics to help drive business growth. is at the doorstep.
There are encouraging signs, however, that this sentiment is on its way out, and with a recession looming, small business leaders are going to need data insights to help optimize their strategies. By analyzing these specific areas of the business, entrepreneurs can readily spot issues and implement improvements.
BI projects aren’t just for the big fishes in the sea anymore; the technology has developed rapidly, the software has become more accessible while business intelligence and analytics projects implemented in various industries regularly, no matter the shape and size, small businesses or large enterprises.
Over the past decade, business intelligence has been revolutionized. Spreadsheets finally took a backseat to actionable and insightful data visualizations and interactive business dashboards. The rise of self-service analytics democratized the data product chain. Suddenly advanced analytics wasn’t just for the analysts.
We already saw earlier this year the benefits of Business Intelligence and BusinessAnalytics. In an article tackling BI and BusinessAnalytics, Better Buys asked seven different BI pros what their thoughts were on the difference between business intelligence and analytics.
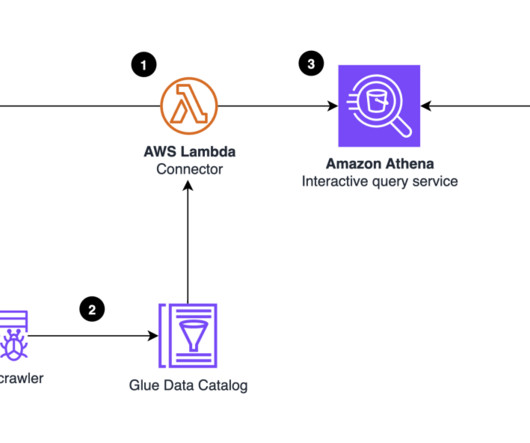
Finally, to visualize BI insights, you can use Amazon QuickSight , a cloud-powered businessanalytics service. QuickSight makes it straightforward for organizations to build visualizations, perform ad hoc analysis, and quickly get business insights from their data, anytime, on any device. Choose Visualize.
BI users analyze and present data in the form of dashboards and various types of reports to visualize complex information in an easier, more approachable way. Business intelligence can also be referred to as “descriptive analytics”, as it only shows past and current state: it doesn’t say what to do, but what is or was.
BI directors, with an average salary of $127,169 per year, lead design and development activities related to the enterprise data warehouse. SAS Certified Specialist: VisualBusinessAnalytics Tableau Certified Data Analyst Tableau Desktop Specialist Tableau Server Certified Associate Certified Business Intelligence Professional (CBIP).
This gives to that sales graph an overall sense of visual contrast which makes it much more digestible at a glance. This most essential of sales graph templates offers a linear visualization of incremental sales success over time, coupled with a quick-glance snapshot of campaign revenue by channel. click to enlarge**.
Business intelligence definition Business intelligence (BI) is a set of strategies and technologies enterprises use to analyze business information and transform it into actionable insights that inform strategic and tactical business decisions. How many members have we lost or gained this month?
Based on that amount of data alone, it is clear the calling card of any successful enterprise in today’s global world will be the ability to analyze complex data, produce actionable insights and adapt to new market needs… all at the speed of thought. Business dashboards are the digital age tools for big data. trillion gigabytes!
The chief aim of data analytics is to apply statistical analysis and technologies on data to find trends and solve problems. Data analytics has become increasingly important in the enterprise as a means for analyzing and shaping business processes and improving decision-making and business results.
For an enterprise company , that can mean building and maintaining data pipelines or optimizing database queries and anything in between. Enterprise companies are naturally complex. By the late 1990s, it was estimated that businesses around the world spent $10 billion per year on these types of enterprise systems.
Business intelligence (BI) analysts transform data into insights that drive business value. This is done by mining complex data using BI software and tools , comparing data to competitors and industry trends, and creating visualizations that communicate findings to others in the organization.
Data visualization techniques are paramount in today’s data-driven world. Mastering data visualization techniques is not just a skill but a necessity for professionals across various industries. Definition and Importance Visualizing data involves representing information through graphical elements like charts and graphs.
It’s necessary to say that these processes are recurrent and require continuous evolution of reports, online data visualization , dashboards, and new functionalities to adapt current processes and develop new ones. You may find different versions of this to adopt but the underlying methodology is the same.
The availability of machine-readable files opens up new possibilities for data analytics, allowing organizations to analyze large amounts of pricing data. Using machine learning (ML) and data visualization tools, these datasets can be transformed into actionable insights that can inform decision-making. Choose Create data set.
A large pharmaceutical BusinessAnalytics (BA) team struggled to provide timely analytical insight to its business customers. However, the BA team spent most of its time overcoming error-prone data and managing fragile and unreliable analytics pipelines. . Visualizations updated per week increased from 50 to 1500.
A few years later and with the advancement of AR technology, the retail enterprise decided to mutate their app into a new one called IKEA studio. Being a large enterprise, Netflix deals with massive amounts of data from its over 150 million subscribers. Behind the scenes. 9) Checking In And Out With Your Smartphone.
Rely on interactive data visualizations. Although it is not a specific step, using intuitive data visualizations still goes into the BI strategy framework as an important element to consider when choosing the right tool for your company. For decades now, data analytics has been considered a segregated task. click to enlarge**.
FineReport is a report-making software designed for enterprises to deal with the needs for various, frequent, or complex reports. It has been recognized in the Honorable Mention of the 2021 Gartner Magic Quadrant for Analytics and Business Intelligence Platforms. Price: Free for personal use; Quote-based Plan for enterprise use.
Dashboard reporting refers to putting the relevant business metrics and KPIs in one interface, presenting them visually, dynamic, and in real-time, in the dashboard formats. Instead, data is drawn from a centralized source and displayed as an easy to interpret visual overview. FineReport. Query2Report. From Google. Highlights?.
With business intelligence(BI) tools play a more critical role in the enterprises, the technology is poised for an oversized effect in the coming year. BI software assists businesses with data display and analytics to help companies discover the situations, market challenges, as well as the chance. Big Data Platform .
Augmented Analytics Tools to Support Business Users and the Organization! Data Science and Predictive Analytics must be made simple, but based on sophisticated features that will enable data modeling and predictive analytics technique.
Today’s enterprise data science teams have one of the most challenging, yet most important roles to play in your business’s ML strategy. In our current landscape, businesses that have adopted a successful ML strategy are outperforming their competitors by over 9%. The implications of ML on the future of business are clear.
How Can SVM Classification Analysis Benefit BusinessAnalytics? Let’s examine two business use cases where SVM Classification can benefit the organization. Fraud Analysis – Based on various bills submitted for employee reimbursement for food, travel, medical expenses etc., Use Case – 1. About Smarten.
The Smarten mobile application provides intuitive dashboards and reports, stunning visualizations, dynamic charts and graphs and key performance indicators (KPIs). All of these tools are designed for business users with average skills and require no special skills or knowledge of statistical analysis or support from IT or data scientists.
Amazon Redshift is the most widely used data warehouse in the cloud, best suited for analyzing exabytes of data and running complex analytical queries. Amazon QuickSight is a fast businessanalytics service to build visualizations, perform ad hoc analysis, and quickly get business insights from your data.
As the concept of businessanalytics becomes more main stream and business users embrace the possibilities, they (and their managers) want and expect even more tools and more potential. Advanced Data Discovery allows business users to quickly and easily prepare and analyze data and visualize and explore data.
There are several reporting tools and platforms available today, and enterprises usually choose the one that is best suited for their business needs. It helps in transforming enterprise data into rich visuals. It also offers a more visual and interactive UI for the reports. SSRS and Microsoft Power BI. Native Mode.
‘NLP search analytics technology improves productivity, user adoption, business results and competitive positioning in the market.’. In this article we define Search Analytics and the WHAT and WHY as well as the BENEFITS of implementing this type of solution.
’ ARIMAX is related to the ARIMA technique but, while ARIMA is suitable for datasets that are univariate (see the article, entitled’ What is ARIMA Forecasting and How Can it Be Used for Enterprise Analysis?’). How Can ARIMAX Forecasting Be Used for Enterprise Analysis?
A BI dashboard — or business intelligence dashboard — is an information management tool that uses data visualization to display KPIs (key performance indicators) tracked by a business to assess various aspects of performance. Defining business dashboard needs. It also offers intuitive data crunching.
Talk to any business colleague or pick up any technology analyst article and you will find plenty of discussion about the current use of data analytics tools and impressive predictions about the growth of this market. Data Analytics is not just for data scientists! There is a reason for that popularity and growth!
Overview: Data science vs data analytics Think of data science as the overarching umbrella that covers a wide range of tasks performed to find patterns in large datasets, structure data for use, train machine learning models and develop artificial intelligence (AI) applications.
June 15, 2020 – insightsoftware, a global provider of enterprise software solutions for the Office of the CFO, today announced a new partnership with interRel Consulting, an Oracle Enterprise Performance Management (EPM) Cloud specialist consulting company based in Arlington, Texas. RALEIGH, N.C. About interRel. About insightsoftware.
How Can Holt-Winters Forecasting Be Used for Enterprise Analysis? These augmented analytics tools use machine learning to auto-detect and recommend the best algorithm so users do not have to guess at the right selection. Smart Visualization ensures that data and its interpretation are clearly depicted in simple, natural language.
This method is used to find groups that have not been explicitly labeled in the data, and it can be used to confirm business assumptions about what types of groups exist, or to identify unknown groups in complex data sets. How Does an Enterprise Use the KMeans Clustering Algorithm to Analyze Data? Use Case – 2.
How Can the ARIMA Forecasting Method Be Used for Enterprise Analysis? Business Problem: A pharmaceutical company wants to predict the sales of a drug for the next two months, based on drug sales data from the past 12 months. It converts non-stationary data to stationary to allow for a fairly constant level over time.
How Can the Karl Pearson Correlation Method Be Used to Target EnterpriseAnalytical Needs? Business Problem: A bank wants to find the correlation between income and credit card delinquency rate of credit card holders. must be converted to numeric ranking, i.e., 1,2,3,4,5.
How Can the Enterprise Use Simple Linear Regression to Analyze Data? Business Problem: An eCommerce company wants to measure the impact of product price on product sales. This method of analysis can handle only two variables, namely one predictor and one dependent variable. Use Case – 1.
We organize all of the trending information in your field so you don't have to. Join 42,000+ users and stay up to date on the latest articles your peers are reading.
You know about us, now we want to get to know you!
Let's personalize your content
Let's get even more personalized
We recognize your account from another site in our network, please click 'Send Email' below to continue with verifying your account and setting a password.
Let's personalize your content