This site uses cookies to improve your experience. To help us insure we adhere to various privacy regulations, please select your country/region of residence. If you do not select a country, we will assume you are from the United States. Select your Cookie Settings or view our Privacy Policy and Terms of Use.
Cookie Settings
Cookies and similar technologies are used on this website for proper function of the website, for tracking performance analytics and for marketing purposes. We and some of our third-party providers may use cookie data for various purposes. Please review the cookie settings below and choose your preference.
Used for the proper function of the website
Used for monitoring website traffic and interactions
Cookie Settings
Cookies and similar technologies are used on this website for proper function of the website, for tracking performance analytics and for marketing purposes. We and some of our third-party providers may use cookie data for various purposes. Please review the cookie settings below and choose your preference.
Strictly Necessary: Used for the proper function of the website
Performance/Analytics: Used for monitoring website traffic and interactions
The vast scope of this digital transformation in dynamic business insights discovery from entities, events, and behaviors is on a scale that is almost incomprehensible. Traditional businessanalytics approaches (on laptops, in the cloud, or with static datasets) will not keep up with this growing tidal wave of dynamic data.
Engaged customers are vital to the success of any business. Analytics is central to understanding what works for your customers. But how do you get them to share actionable data? Of course, customers are willing to share data in return for better services and products. These require customer data.
Use an interpretable approach to forecasting electricity demand data for California. The AMP implements both a model diagnostic app and a small forecasting interface that allows asking smart, probabilistic questions of the forecast. This notebook also demonstrates several downstream analyses. Structural Time Series. Stay tuned!
I’m sure you’ve already ready a number of trends and forecasts for 2021. Here I’ll comment on a few of the data and analytics-focused trends we see that will impact insurers in 2021 and beyond. . Check out our webinar with Privitar. . Trend #1: Expanded Use of ML/AI as Part of Digital Acceleration. What’s Next?
As such, planning becomes a continuous rolling activity as the lines between “plan”, “budget” and “forecast” are blurred. QueBIT’s webinar includes a demonstration with IBM Planning Analytics of the interplay between all these components, beginning with the demand plan and ending with the impact on financial statements.
This past Tuesday, my amazing colleague Cindi Howson and I conducted a Webinar, “Using The BI and Analytics Magic Quadrant To Modernize Your Capabilities”. We didn’t have time to get to all the great questions, so below are a few responses, plus some really interesting results from the webinar poll. Moving to Modern.
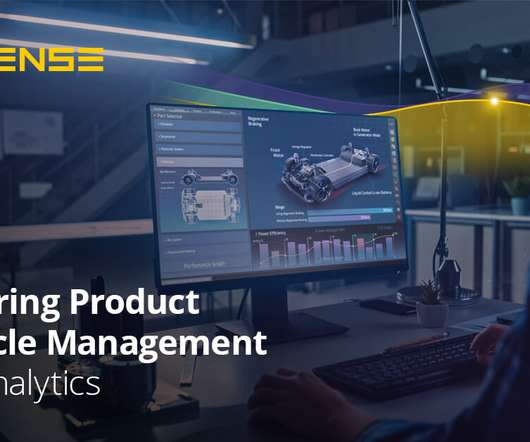
API integrations for third-party analytics platforms like Sisense now make it easy to harness the forecasting power of AI. Whatever you’re working on, the right analytics for your PDM or PLM data can help you build better products, services, and experiences that will delight your users and stand the test of time.
Cash flow projections (also known as cash flow forecasting ) is the process of estimating and predicting the cash inflows, cash outflows, and cash balance a business can expect over a specific period of time, typically in the short- to medium-term.
We asked webinar attendees to report how their tax department is viewed by other coworkers. Reshaping Future Growth: Top Tips on How to Manage Tax Forecasts. As the world demands greater business agility, and as BEPS promises to radically shift the tax landscape, tax departments have a powerful case for change. Download Now.
Utilize SAP Data for Faster and More Accurate Forecasting. Recently, insightsoftware broke this all down in a webinar created and led by Richard den Ouden, the co-founder of Angles of SAP. The on-demand webinar is available here. In addition to the webinar, you can access an instant demo for Angles for SAP here.
Check out our webinar on self-service subledger reconciliations for a quick primer on when and how to best use self-service subledger reconciliations for your organization. Watch this webinar for best practice tips on how to remove complexity and save time with quick, easy general ledger and subledger reconciliations.
Tangibly, this means more planning, more accurate and deeper forecasting, and more strategic decision-making based on real-time reporting. If you want to hear more, check out our webinar where a panel of experts discuss the evolving role of finance and how teams can prepare for change next year. No high pressure sales pitch.
It’s an exciting step on your BI journey – from here, your business decisions will become more data-driven, and your team will be more empowered than ever to understand your businessanalytics. The Qlik Learning Portal offers a Self-Paced Learning virtual classroom that you can try for free.
Watch our on-demand webinar on how to redefine your Oracle ERP project-centric solutions. You can ‘set and forget’ an automated report distribution schedule to regularly connect your key stakeholders and project managers with the insight they need. Ready to learn more?
Where Jet Reports addresses reporting gaps, Jet Analytics brings all your data together in Power BI, allowing you to analyze trends and forecast scenarios through a channel your executives can easily understand. Jet Analytics provides data warehouse automation for fast, consistent businessanalytics and master data management.
Flexible license agreement that optimizes and allows your business to “grow-as-you-go,” a fast and efficient provisioning and deployment process, context-rich business models that adapt to your ERP system’s unique configuration. For more information or to request a demo, visit our webinar on Angles and OCA here.
Additionally, you’ll notice greater adoption of your data analytics tools and happier, more data-driven end-users. Check out this webinar to see how Logi Symphony provides the self-service BI your team needs, or visit [link] to arrange a demo. Go to market sooner so you can set yourself apart.
Live demo tailored to your business requirements. Interested in BusinessAnalytics and Dashboards. Discover which solutions are best suited for your needs. No high pressure sales pitch. Interested in Financial Reporting. Interested in Data Warehousing/BI Cubes. Interested in Multiple Companies/Databases Consolidation.
Key factors to consider include: Availability of live client support via phone, email, or chat Access to online resources , such as help articles, tutorials, and videos Availability of personalized training sessions or webinars Ongoing software updates and enhancements By choosing a vendor that offers comprehensive support and training, you can ensure (..)
We organize all of the trending information in your field so you don't have to. Join 42,000+ users and stay up to date on the latest articles your peers are reading.
You know about us, now we want to get to know you!
Let's personalize your content
Let's get even more personalized
We recognize your account from another site in our network, please click 'Send Email' below to continue with verifying your account and setting a password.


Let's personalize your content