This site uses cookies to improve your experience. To help us insure we adhere to various privacy regulations, please select your country/region of residence. If you do not select a country, we will assume you are from the United States. Select your Cookie Settings or view our Privacy Policy and Terms of Use.
Cookie Settings
Cookies and similar technologies are used on this website for proper function of the website, for tracking performance analytics and for marketing purposes. We and some of our third-party providers may use cookie data for various purposes. Please review the cookie settings below and choose your preference.
Used for the proper function of the website
Used for monitoring website traffic and interactions
Cookie Settings
Cookies and similar technologies are used on this website for proper function of the website, for tracking performance analytics and for marketing purposes. We and some of our third-party providers may use cookie data for various purposes. Please review the cookie settings below and choose your preference.
Strictly Necessary: Used for the proper function of the website
Performance/Analytics: Used for monitoring website traffic and interactions
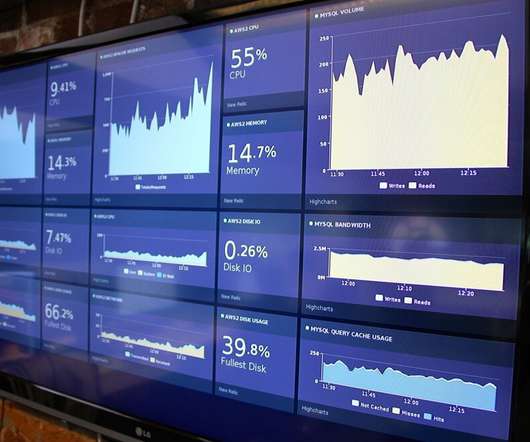
Real-time dashboards provide a single view to the most important performance metrics for an organization. Real-time dashboards show up on big screens in call centers, monitors in marketing departments, or the desk of a fictitious Private Equity titan on the TV show ‘Billions’. Dashboard from Motadata. staffing levels).
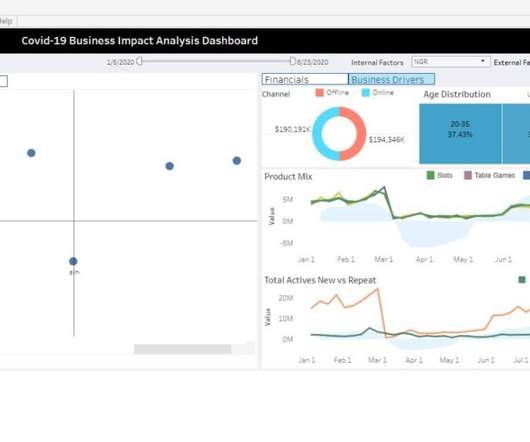
As customers become more data driven and use data as a source of competitive advantage, they want to easily run analytics on their data to better understand their core businessdrivers to grow sales, reduce costs, and optimize their businesses.
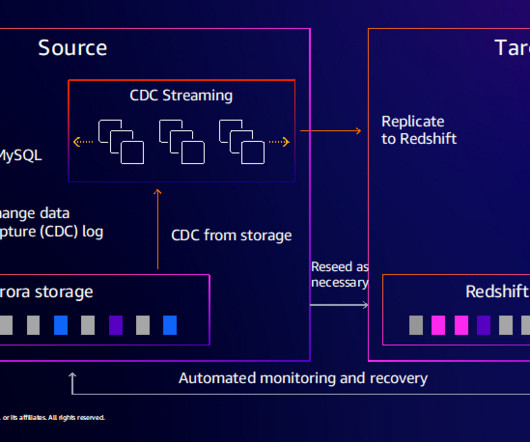
By using dbt Cloud for data transformation, data teams can focus on writing business rules to drive insights from their transaction data to respond effectively to critical, time sensitive events. Solution overview Let’s consider TICKIT , a fictional website where users buy and sell tickets online for sporting events, shows, and concerts.
And while cloud-native architecture is paramount to drive the future of analytics apps, AI is also a critical component in order to reduce manual, repetitive steps during data prep and give business users the ability to gain new insights from which they can take action.
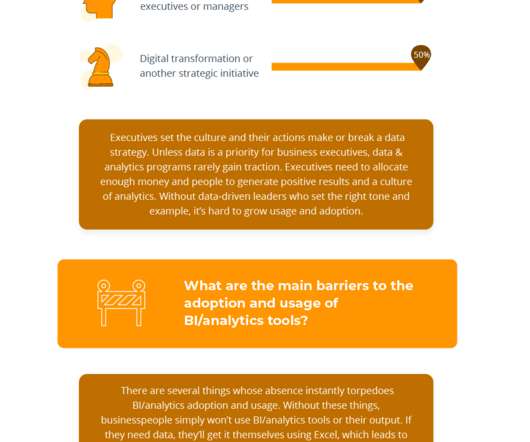
customers and suppliers) using external-facing reports and dashboards. The primary technical drivers of increased usage are “self-service authoring tools” (73%), data preparation tools (48%), and “embedded BI/analytics” (38%). Businessdrivers. Govern self-service. Tear down the data silos. Embed analytics. s ecosystem.
But taking this kind of butler approach to the organization’s future of work mission and waiting for businessdrivers can be shortsighted. CIOs should define a citizen development governance model and govern citizen data science so that no-code apps and dashboards developed today don’t become tomorrow’s technical debt.
Their dashboards were visually stunning. In turn, end users were thrilled with the bells and whistles of charts, graphs, and dashboards. As rich, data-driven user experiences are increasingly intertwined with our daily lives, end users are demanding new standards for how they interact with their business data.
We organize all of the trending information in your field so you don't have to. Join 42,000+ users and stay up to date on the latest articles your peers are reading.
You know about us, now we want to get to know you!
Let's personalize your content
Let's get even more personalized
We recognize your account from another site in our network, please click 'Send Email' below to continue with verifying your account and setting a password.


Let's personalize your content