This site uses cookies to improve your experience. To help us insure we adhere to various privacy regulations, please select your country/region of residence. If you do not select a country, we will assume you are from the United States. Select your Cookie Settings or view our Privacy Policy and Terms of Use.
Cookie Settings
Cookies and similar technologies are used on this website for proper function of the website, for tracking performance analytics and for marketing purposes. We and some of our third-party providers may use cookie data for various purposes. Please review the cookie settings below and choose your preference.
Used for the proper function of the website
Used for monitoring website traffic and interactions
Cookie Settings
Cookies and similar technologies are used on this website for proper function of the website, for tracking performance analytics and for marketing purposes. We and some of our third-party providers may use cookie data for various purposes. Please review the cookie settings below and choose your preference.
Strictly Necessary: Used for the proper function of the website
Performance/Analytics: Used for monitoring website traffic and interactions
Over the past decade, businessintelligence has been revolutionized. Spreadsheets finally took a backseat to actionable and insightful data visualizations and interactive businessdashboards. 2019 was a particularly major year for the businessintelligence industry. Data exploded and became big.
Enter data dashboards – one of history’s best innovations in businessintelligence. To help you understand this notion in full, we’re going to explore a data dashboard definition, explain the power of dashboard data, and explore a selection of data dashboard examples. What Is A Data Dashboard?
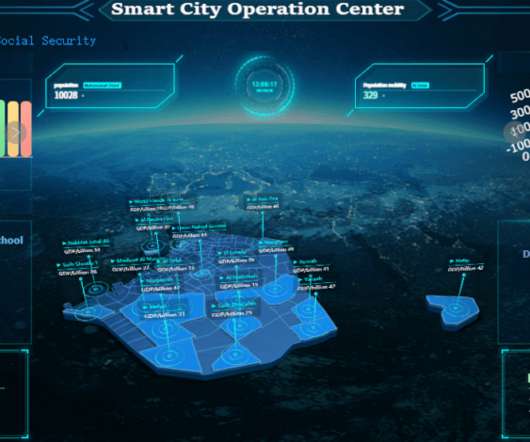
The rise of innovative, interactive, data-driven dashboard tools has made creating effective dashboards – like the one featured above – swift, simple, and accessible to today’s forward-thinking businesses. Dashboard design should be the cherry on top of your businessintelligence (BI) project.
The secret is out, and has been for a while: In order to remain competitive, businesses of all sizes, from startup to enterprise, need businessintelligence (BI). But what do you do with all this businessintelligence? This is where the power of businessdashboards comes into play.
Digital data, by its very nature, paints a clear, concise, and panoramic picture of a number of vital areas of business performance, offering a window of insight that often leads to creating an enhanced businessintelligence strategy and, ultimately, an ongoing commercial success. 1) Improving The Decision-Making Process.
Data observability is a key aspect of data operations (DataOps), which focuses on the application of agile development, DevOps and lean manufacturing by data engineering professionals in support of data production. The ability to monitor and measure improvements in data quality relies on instrumentation.
What is one strategic businessintelligence (BI) mechanism that is absolutely necessary in the digital age? An online BI dashboard. Thanks to specific businessintelligence best practices for dashboard design. Exclusive Bonus Content: Download Our Free Dashboard Checklist! How can you create one?
Google Cloud Platform (GCP) is set to release two new solutions targeted at the manufacturing sector and aiming to ease data engineering and analytics tasks, unifying data from diverse machine assets to offer business insights to factory managers. Manufacturing apps integrate with other Google offerings. billion by 2026. “We
Leading companies make use of KPIs and KPI dashboards to measure their efficiency in real time. Manufacturing. The manufacturing industry is continually moving toward automation and away from manual labor. Manufacturing Operational Key Performance Indicators. How an Operations Dashboard Can Streamline Your Reporting.
For example, at a company providing manufacturing technology services, the priority was predicting sales opportunities, while at a company that designs and manufactures automatic test equipment (ATE), it was developing a platform for equipment production automation that relied heavily on forecasting. And guess what? And guess what?
Automated reports completely eliminate traditional means of communicating data since they rely on business reporting software that uses cutting edge businessintelligence, technology and smart features such as interactivity, a drag-and-drop interface, and predictive analytics, among others.
Project dashboard, also known as project management dashboard, helps show the current project progress like a car dashboard and provide feedback to the team. What is a project dashboard? As mentioned above, project dashboard is similar to the car dashboard. reality use of dashboard . Free trial.
In the matter, data analysis and dashboard designer software is a precious ally. We will finish by presenting a businessdashboard that will show how those metrics work together when depicting an inventory data-story. Inventory Metrics Examples On Dynamic Dashboards. a) Inventory analytics dashboard for supply chain.
Under this situation, production dashboard seems vital for companies to command their manufacturing operations. What is a production dashboard? Production dashboard, also known as manufacturingdashboard, belongs to KPI dashboards but more targets on manufacturing indicators.
Business leaders, developers, data heads, and tech enthusiasts – it’s time to make some room on your businessintelligence bookshelf because once again, datapine has new books for you to add. We have already given you our top data visualization books , top businessintelligence books , and best data analytics books.
The client is one of the leading pipe manufacturers in India and among only a few companies adopting the latest technology and quality control programs that are widely accepted at a global level to develop CPVC plumbing systems as per the Indian plumbing market. The company has manufacturing units at Gujarat, Himachal Pradesh, and Tamil Nadu.
In the modern era, businesses are continually looking for a competitive advantage—something that will allow them to deliver goods or services at a lower cost, higher quality, and faster speed than their competitors. Data Mining and BusinessIntelligence.
In this blog post, we are going to cover the role of businessintelligence in demand forecasting, an area of predictive analytics focused on customer demand. We’ll explain what it is, how it works, and ways to start using demand forecasting with businessintelligence software. BusinessIntelligence Trends in 2019.
Today, real time businessintelligence is a necessity more than a luxury, so it’s important to understand exactly what it is, and what it can do for you. What is Real-Time BusinessIntelligence? This allows dashboards to show both real-time and historic data in a holistic way.
Manufacturingdashboards, or sometimes, we say production dashboards, monitor the most important KPIs in the manufacturing process. the production dashboard seems vital for companies to command their manufacturing operations and to realize the value of data. Definition of ManufacturingDashboard.
There are many chart types available and each one of them plays an important role in a professional BI dashboard. The gauge chart is a suitable chart for executive dashboards. For project progress or deadlines: Gauge charts tracking project progress or deadlines play an important role in a businessdashboard.
With the emergence of GenAI capabilities, fast-tracking digital transformation deployments are likely to change manufacturing as we know it, creating an expanding chasm of leaders versus followers, the latter of which will risk obsolescence. Accelerated edge devices and IT/OT convergence capabilities are vital in manufacturing.
What Is A Manufacturing KPI? A manufacturing Key Performance Indicator (KPI) or metric is a well defined and quantifiable measure that the manufacturing industry uses to gauge its performance over time. Why Your Company Should Be Using Manufacturing Specific KPIs to Stay Competitive. How to Build Useful KPI Dashboards.
When analytics and dashboards are inaccurate, business leaders may not be able to solve problems and pursue opportunities. Since 2008, teams working for our founding team and our customers have delivered 100s of millions of data sets, dashboards, and models with almost no errors. Data operations is manufacturing.
In today’s fast-paced business environment, making informed decisions based on accurate and up-to-date information is crucial for achieving success. With the advent of BusinessIntelligenceDashboard (BI Dashboard), access to information is no longer limited to IT departments.
Bayer Crop Science has applied analytics and decision-support to every element of its business, including the creation of “virtual factories” to perform “what-if” analyses at its corn manufacturing sites. ERP dashboards. Decision support systems vs. businessintelligence DSS and businessintelligence (BI) are often conflated.
The results appear in a collection of dashboards or automated graphical visualizations. Anyone who works in manufacturing knows SAP software. The tool builds heavily on businessintelligence and reporting by treating predictions as just another column in the analytics presentation. Extras are priced by the sales team.
In business analytics, this is the purview of businessintelligence (BI). More specifically: Descriptive analytics uses historical and current data from multiple sources to describe the present state, or a specified historical state, by identifying trends and patterns.
This blog series follows the manufacturing, operations and sales data for a connected vehicle manufacturer as the data goes through stages and transformations typically experienced in a large manufacturing company on the leading edge of current technology. 1 The enterprise data lifecycle. Data Enrichment Challenge.
The CDH serves as a centralized repository for petabytes of data from engineering, manufacturing, sales, and vehicle performance and provides BMW employees with a unified view of the organization and acts as a starting point for new development initiatives.
KPI dashboard releases you from your worries and troubles. What is a KPI dashboard? Definition of KPI dashboard. KPI dashboard uses interactive charts and data visualization to gather all your KPIs on one dashboard for easy viewing, comparison and analysis. Reality Use of KPI Dashboard.
According to IDC Semiannual Software Tracker for the First Half of 2019, China’s businessintelligence software market size was $ 210 million in the first half of 2019, with a year-on-year increase of 24.6%. By 2023, the size of China’s businessintelligence software market will reach $ 1.65 respectively.
The data engineer then emails the BI Team, who refreshes a Tableau dashboard. The delays impact delivery of the reports to senior management, who are responsible for making business decisions based on the dashboard. I use the business rules I received from the business analyst to process the source data using Python.
Provide a methodical approach to KPI dashboards and reports. Notably, it focuses solely on the order itself and excludes the manufacturing and delivery of the product or material. A testament to the power of using a KPI real-time dashboard to enhance internal performance. Come with an exemplary level of user support.
Nowadays, the businessintelligence market is heating up. Both the investment community and the IT circle are paying close attention to big data and businessintelligence. They prefer self-service development, interactive dashboards, and self-service data exploration. Analytics dashboards. In the end.
In today’s data-driven landscape, businesses are leaning more on BI tools , particularly BI dashboard solutions, to enhance decision-making through data visualization. These BI Dashboard tools blend advanced analytics with user-friendly interfaces, revealing invaluable insights.
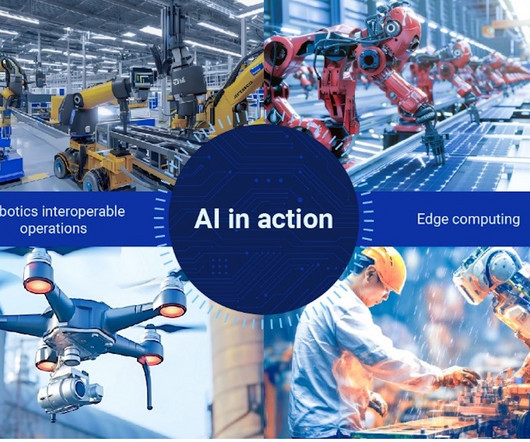
For example, robotics have long played a significant role in the industrial sector at the edge, from discrete manufacturing to continuous batch processing and hybrid manufacturing. Natural language processing (NLP) helps humans interact naturally with robots via dashboards, text, speech, or speech-to-text.
This feature enables users to save calculations from a Tableau dashboard directly to Tableau’s metrics layer so they can monitor and track the information over time. Artificial Intelligence, BusinessIntelligence, Data Visualization, Generative AI Metrics Bootstrapping.
Today, Dell and others in the industry use a cradle-to-grave assessment tool called the Product Attribute to Impact Algorithm (PAIA) , which calculates emissions related to four key lifecycle stages of a product: manufacturing, use (i.e., energy), transportation, and end of life over a period of four years.
In this article, we will discuss Mobile BusinessIntelligence, also known as Mobile BI. This article will help businesses to understand the value of a mobile BI approach, and Mobile BusinessIntelligence best practices. Let’s start by answering the question, ‘ what is mobile BI ?’
In this blog post, we are going to cover the role of businessintelligence in demand forecasting, an area of predictive analytics focused on customer demand. We’ll explain what it is, how it works, and ways to start using demand forecasting with businessintelligence software. BusinessIntelligence Trends in 2019.
The businessintelligence industry has been revolutionized over the past decade and data reports are in on the fun. If you utilize businessintelligence correctly, not only you will be able to connect your data dots, but take control of your data across the company and improve your bottom line.
We coordinate donations from manufacturers, retailers, grocers. The data warehouse was built on Google Cloud with Informatica Intelligent Cloud Services for data integration and Tableau for data outputs. Byrdak’s team connected it to individual food bank ERP platforms to deliver dashboards on food sourcing and distribution.
Unlike many other events, which consist of multiple racing teams and manufacturers, Porsche Carrera Cup Brasil provides and maintains all 75 cars used in the race. So Morrone and his engineers no longer need to rely on drivers reading indicators on their dashboards and passing along information.
We organize all of the trending information in your field so you don't have to. Join 42,000+ users and stay up to date on the latest articles your peers are reading.
You know about us, now we want to get to know you!
Let's personalize your content
Let's get even more personalized
We recognize your account from another site in our network, please click 'Send Email' below to continue with verifying your account and setting a password.


Let's personalize your content