Remove Business Intelligence Remove Dashboards Remove Visualization
article thumbnail

Open-Source BI Tool Metabase for Data Visualization and Analytics

Analytics Vidhya

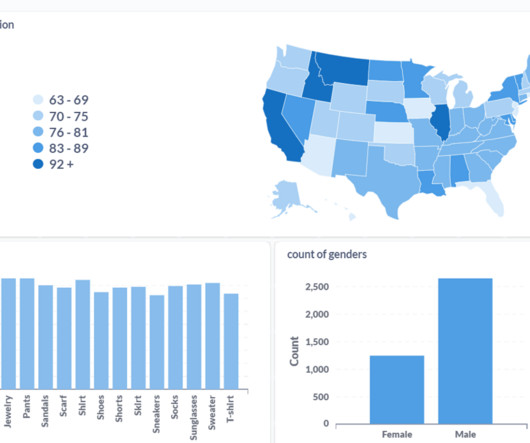
Try Metabase, an open-source Business Intelligence (BI) tool for creating interactive dashboards from large datasets. Learning […] The post Open-Source BI Tool Metabase for Data Visualization and Analytics appeared first on Analytics Vidhya. Introduction Are you a passionate data professional exploring new tools?

article thumbnail

Introduction To The Basic Business Intelligence Concepts

datapine

This concept is known as business intelligence. Business intelligence, or “BI” for short, is becoming increasingly prevalent across industries each year. But with business intelligence concepts comes a great deal of confusion, and ultimately – unnecessary industry jargon. Learn here! But more on that later.

Insiders

Sign Up for our Newsletter

This site is protected by reCAPTCHA and the Google Privacy Policy and Terms of Service apply.

article thumbnail

An Introduction To Data Dashboards: Meaning, Definition & Industry Examples

datapine

Enter data dashboards – one of history’s best innovations in business intelligence. To help you understand this notion in full, we’re going to explore a data dashboard definition, explain the power of dashboard data, and explore a selection of data dashboard examples. What Is A Data Dashboard?

article thumbnail

Get The Most Out Of Smart Business Intelligence Reporting

datapine

Spreadsheets no longer provide adequate solutions for a serious company looking to accurately analyze and utilize all the business information gathered. That’s where business intelligence reporting comes into play – and, indeed, is proving pivotal in empowering organizations to collect data effectively and transform insight into action.

article thumbnail

Monetizing Analytics Features: Why Data Visualizations Will Never Be Enough

Think your customers will pay more for data visualizations in your application? But today, dashboards and visualizations have become table stakes. Five years ago they may have. Discover which features will differentiate your application and maximize the ROI of your embedded analytics. Brought to you by Logi Analytics.

article thumbnail

14 Dashboard Design Principles & Best Practices To Enhance Your Data Analysis

datapine

The rise of innovative, interactive, data-driven dashboard tools has made creating effective dashboards – like the one featured above – swift, simple, and accessible to today’s forward-thinking businesses. Dashboard design should be the cherry on top of your business intelligence (BI) project.

article thumbnail

Accomplish Agile Business Intelligence & Analytics For Your Business

datapine

When encouraging these BI best practices what we are really doing is advocating for agile business intelligence and analytics. Therefore, we will walk you through this beginner’s guide on agile business intelligence and analytics to help you understand how they work and the methodology behind them.