This site uses cookies to improve your experience. To help us insure we adhere to various privacy regulations, please select your country/region of residence. If you do not select a country, we will assume you are from the United States. Select your Cookie Settings or view our Privacy Policy and Terms of Use.
Cookie Settings
Cookies and similar technologies are used on this website for proper function of the website, for tracking performance analytics and for marketing purposes. We and some of our third-party providers may use cookie data for various purposes. Please review the cookie settings below and choose your preference.
Used for the proper function of the website
Used for monitoring website traffic and interactions
Cookie Settings
Cookies and similar technologies are used on this website for proper function of the website, for tracking performance analytics and for marketing purposes. We and some of our third-party providers may use cookie data for various purposes. Please review the cookie settings below and choose your preference.
Strictly Necessary: Used for the proper function of the website
Performance/Analytics: Used for monitoring website traffic and interactions
Spreadsheets no longer provide adequate solutions for a serious company looking to accurately analyze and utilize all the business information gathered. That’s where businessintelligence reporting comes into play – and, indeed, is proving pivotal in empowering organizations to collect data effectively and transform insight into action.
Data analytics isn’t just for the Big Guys anymore; it’s accessible to ventures, organizations, and businesses of all shapes, sizes, and sectors. The power of data analytics and businessintelligence is universal. Download our game-changing summary and see your company grow! Let’s get started!
As such, we have to find approaches to data analytics and businessintelligence. Not to forget, to squeeze the most value from your business’s most valuable data across touchpoints, it’s important to analyze it as it unfolds. Download our executive, pocket-sized guide to real time BI and analytics! click to enlarge**.
The secret is out, and has been for a while: In order to remain competitive, businesses of all sizes, from startup to enterprise, need businessintelligence (BI). But what do you do with all this businessintelligence? This is where the power of business dashboards comes into play.
In order to succeed in the rapidly changing the business world, today’s organizations must use data as the driving force to promote the establishment of a data-driven culture. Therefore, leaders need a modern businessintelligence platform to help people view and understand their own data. Free Download. FineReport.
Dashboard design should be the cherry on top of your businessintelligence (BI) project. Exclusive Bonus Content: Download Dashboard Design Tips & Tricks! Get our entirely free checklist to build high-quality business dashboards! Exclusive Bonus Content: Download Dashboard Design Tips & Tricks!
Download our bite-sized guide and unlock your fullest analysis potential! Data analysis method focuses on strategic approaches to taking raw data, mining for insights that are relevant to the business’s primary goals, and drilling down into this information to transform metrics, facts, and figures into initiatives that benefit improvement.
Exclusive Bonus Content: Boost your healthcare business with big data! Download our free bite-sized summary and see our top examples! Analytics, already trending as one of the businessintelligence buzzwords in 2019, has the potential to become part of a new strategy. What Is Big Data In Healthcare? on a permanent basis.
By leveraging the wealth of digital insights available at your fingertips and embracing the power of businessintelligence , it’s possible to make more informed decisions that will lead to commercial growth, evolution, and an increased bottom line. Download the list of the 11 essential steps to implement your BI strategy!
Compassion and people skills aside, every strong business leader needs the vision to be the best they can be. Download our short summary and become the best leader you can be! Enhanced businessintelligence that will lead to growth and boost your bottom line. It offers the following benefits: Improved decision-making.
Download our free executive summary and start creating your stories! Storytelling through data is the process of transforming data-driven analyses into a widely-accessible visual format to influence a business decision, strategy, or action by utilizing analytical information that, ultimately, turn into actionable insights.
What is one strategic businessintelligence (BI) mechanism that is absolutely necessary in the digital age? Thanks to specific businessintelligence best practices for dashboard design. Exclusive Bonus Content: Download Our Free Dashboard Checklist! An online BI dashboard. How can you create one?
A businessintelligence dashboard coupled with a dynamic dashboard display will allow you to squeeze every last drop of value from the insights that matter most. Download our bite-sized guide and learn everything you need to know! Download our bite-sized guide and learn everything you need to know! click to enlarge**.
Not to worry – we’ll not only explain the link between big data and businessperformance but also explore real-life performance dashboard examples and explain why you need one (or several). Exclusive Bonus Content: Stay on top of your businessperformance! The Link Between Data And BusinessPerformance.
More and more companies are now using businessintelligence to improve their management efficiency and operating conditions. As important parts of businessintelligence, scorecard and dashboard can both play an obvious role in promoting enterprise development. businessintelligence. What is a scorecard?
Download: A pocket-sized guide to operational and strategic reports! Operational reporting is an effective, results-driven means of tracking, measuring and analyzing a business’s regular deliverables and metrics, usually on a daily, weekly, and sometimes monthly basis with the help of modern and professional BI reporting tools.
Businessintelligence strategy is seen as a roadmap designed to help companies measure their performance and strengthen their performance through architecture and solutions. BI dashboard shows key information(by FineReport). There are several steps to follow when developing a businessintelligence strategy.
Similarly, 52% used SaaS applications for human resources (HR) management, while half of those surveyed also preferred SaaS for businessintelligence tools and customer relationship management. It also delineated seven keyperformanceindicators (KPIs) with detailed analysis across industries.
Download our free executive summary and boost your sales strategy! Download our free executive summary and boost your sales strategy! Download our free executive summary and boost your sales strategy! Download our free executive summary and boost your sales strategy! From Fiction To Reality. 5) Sales Cycle.
Download our bite-sized guide and learn everything you need to know! While real time reporting tools offer a seemingly endless level of scope for improving decision-making and fostering a culture of businessintelligence (BI), static or traditional reporting methods are worth archiving for historical performance reference.
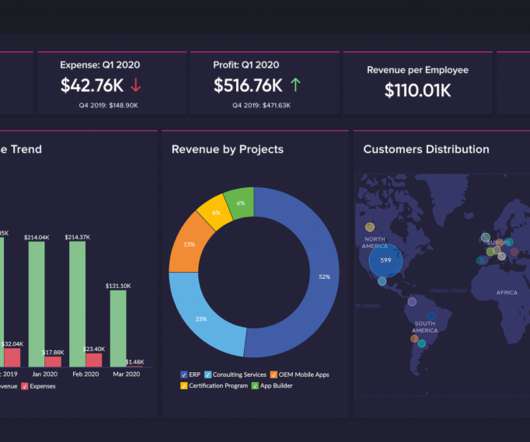
As important parts of businessintelligence, scorecards and dashboards can both play an obvious role in promoting enterprise performance management. As a businessintelligence tool, dashboards visualize large amounts of data in the form of charts, which can help companies monitor relevant information at a glance.
By combining the art of storytelling with the technological capabilities of dashboard software , it’s possible to develop powerful, meaningful, data-backed presentations that not only move people but also inspire them to take action or make informed, data-driven decisions that will benefit your business. What Is Dashboard Storytelling?
It is considered as one of the best businessintelligence innovations in the 21st century. If you are interested in these data dashboard templates, you can download FineReport for free. Free Download. Business Data Dashboard. Business Data Dashboard(made by FineReport). Free Download.
By gaining the ability to gather, organize and analyze the metrics that are most important to your organization, you stand to make your business empire more intelligent than ever before – and executive reporting and business dashboards will help you do just that. Set your keyperformanceindicators (KPIs).
An Operations KeyPerformanceIndicator (KPI) or metric is a discrete measurement that a company uses to monitor and evaluate the efficiency of its day-to-day operations. Download Now. As such, it is important to understand your work force sentiment and how they are performing. What is an Operations KPI?
So it is often used as a visual representation of the company’s keyperformanceindicators (KPI). Free Download. The goal of reporting tools and businessintelligence tools is to translate data into actionable information. Free Download. Dashboard Reporting (by FineReport). FineReport.
" That will lead to: "Awesome, I know exactly which critical few KeyPerformanceIndicators I'll be showing in our dashboard." Every element in the dashboard has a purpose and is tied to a business priority. I added the 1234 to download 1,234 rows of data. Now hit the Enter key on your keyboard.
In this article, we will discuss Mobile BusinessIntelligence, also known as Mobile BI. This article will help businesses to understand the value of a mobile BI approach, and Mobile BusinessIntelligence best practices. Let’s start by answering the question, ‘ what is mobile BI ?’
businessintelligence) such as FineReport provides drill-down capabilities so that users can switch from a more general view of data to a more specific view with a single click of the mouse. Free Download. The key deliverables of analysis are the answers to particular questions. Free Download.
With its integrated search feature, Octopai’s visual metadata tools can find all the information within a given context, such as terminology, definitions, technical metadata, keyperformanceindicators, and process areas. . Data lineage is incomplete without the business layer provided by an Automated Business Glossary.
Actually, it, to be specific, is a type of graphical user interface that often offers intelligent views of keyperformanceindicators (KPIs) related to certain objectives or business processes. Two major features: Check your business operation and goals Explore the hidden data to uncover actionable insights.
If the business wishes to encourage data literacy and increase business value, it must carefully select its analytical tools and solutions. In this article, we provide a short list of factors your business should consider when selecting a businessintelligence and augmented analytics tool with mobile capabilities.
The businessintelligence industry has been revolutionized over the past decade and data reports are in on the fun. If you utilize businessintelligence correctly, not only you will be able to connect your data dots, but take control of your data across the company and improve your bottom line. What Is A Data Report?
Or, the BusinessIntelligence tool of choice used by your company. Download the detailed lifetime value model included in the post, and jumpstart your journey. You’ll have a number that’ll accommodate for a sale that might have happened on your website vs. retail store vs. placed on website but picked up on retail, etc.
Under scrutiny to demonstrate the value they add to a company’s strategy, many human resources (HR) departments are turning to analytics supported by keyperformanceindicators (KPIs) and metrics. Download Now. Assessing HR Goals. How to Build Useful KPI Dashboards.
Incremental Sales Calculation As mentioned, incremental sales are used by businesses as a keyperformanceindicator to measure the financial success of their promotional efforts. But how do you calculate the impact of your promotional strategies? Keep reading to find out!
With it, you could visually track, analyze and display graph, charts, keyperformanceindicators to monitor the progress of your business. For managers, the dashboard app could display businessperformance, effectively monitor ongoing program, predict current trends, and identify new opportunities.
Your business should be aware that there are some challenges with mobile businessintelligence solutions. If you want to expand your businessintelligence solution to include mobile BI, will the existing BI tools integrate with a mobile solution? and we will discuss some of the possible issues and challenges.
Data visualizations of keyperformanceindicators (KPI) can even be sent automatically to users as they change, allowing them to make faster, smarter decisions. JavaScript data visualization libraries don’t just create beautiful visuals, they help make businessintelligence (BI) more real to end-users.
By integrating augmented analytics with businessintelligence and reporting, you can encourage data-driven decisions, and leverage intuitive dashboards, keyperformanceindicators (KPIs) and sophisticated (easy-to-use) reports to support your business users and improve time to market, the quality of decisions and the ability to collaborate.
Monitoring keyperformanceindicators (KPIs) using modern KPI software is a definitive method to monitor your most relevant KPIs and achieve increased success. Tracking KPIs enables you to acquire valuable businessintelligence. You can download FineReport for free and have a try! What Is KPI Tracking?
Keyperformanceindicators: Dashboard reporting tools bring together data from multiple areas displaying the information as easy to understand visuals in real-time. It provides managers with an overview of current KPIs to assess different performance areas while creating actionable insights. Free Download.
Companies can use performance dashboards to guide various indicators, ranging from checking the ability of a department to monitoring the availability of business strategies for global organizations. Performance dashboard is mainly composed of two main entities, keyperformanceindicators (KPI) and dimensions.
Have no idea how to select keyperformanceindicators from piles of indicators? KPIs (Keyperformanceindicators) are quantitative indicators used to measure the work performance of staff, being the foundation of an enterprise performance management system. Free Download.
We organize all of the trending information in your field so you don't have to. Join 42,000+ users and stay up to date on the latest articles your peers are reading.
You know about us, now we want to get to know you!
Let's personalize your content
Let's get even more personalized
We recognize your account from another site in our network, please click 'Send Email' below to continue with verifying your account and setting a password.


Let's personalize your content