This site uses cookies to improve your experience. To help us insure we adhere to various privacy regulations, please select your country/region of residence. If you do not select a country, we will assume you are from the United States. Select your Cookie Settings or view our Privacy Policy and Terms of Use.
Cookie Settings
Cookies and similar technologies are used on this website for proper function of the website, for tracking performance analytics and for marketing purposes. We and some of our third-party providers may use cookie data for various purposes. Please review the cookie settings below and choose your preference.
Used for the proper function of the website
Used for monitoring website traffic and interactions
Cookie Settings
Cookies and similar technologies are used on this website for proper function of the website, for tracking performance analytics and for marketing purposes. We and some of our third-party providers may use cookie data for various purposes. Please review the cookie settings below and choose your preference.
Strictly Necessary: Used for the proper function of the website
Performance/Analytics: Used for monitoring website traffic and interactions
Over the past decade, businessintelligence has been revolutionized. Spreadsheets finally took a backseat to actionable and insightful data visualizations and interactive business dashboards. 2019 was a particularly major year for the businessintelligence industry. Data exploded and became big.
Spreadsheets no longer provide adequate solutions for a serious company looking to accurately analyze and utilize all the business information gathered. That’s where businessintelligence reporting comes into play – and, indeed, is proving pivotal in empowering organizations to collect data effectively and transform insight into action.
When encouraging these BI best practices what we are really doing is advocating for agile businessintelligence and analytics. Therefore, we will walk you through this beginner’s guide on agile businessintelligence and analytics to help you understand how they work and the methodology behind them.
1) What Is BusinessIntelligence And Analytics? 4) How Do BI And BA Apply To Business? If someone puts you on the spot, could you tell him/her what the difference between businessintelligence and analytics is? We already saw earlier this year the benefits of BusinessIntelligence and Business Analytics.
4) BusinessIntelligence Job Roles. Do you find computer science and its applications within the business world more than interesting? If you answered yes to any of these questions, you may want to consider a career in businessintelligence (BI).In So, what skills are needed for a businessintelligence career?
Data analytics isn’t just for the Big Guys anymore; it’s accessible to ventures, organizations, and businesses of all shapes, sizes, and sectors. The power of data analytics and businessintelligence is universal. Entrepreneurs And BusinessIntelligence Challenges. Let’s get started!
Using businessintelligence and analytics effectively is the crucial difference between companies that succeed and companies that fail in the modern environment. Experience the power of BusinessIntelligence with our 14-days free trial! Why Is BusinessIntelligence So Important? The power of knowledge.
1) What Is A BusinessIntelligence Strategy? 4) How To Create A BusinessIntelligence Strategy. Odds are you know your business needs businessintelligence (BI). In response to this increasing need for data analytics, businessintelligence software has flooded the market.
Businessintelligence has undergone many changes in the last decade. Each year, we hear about buzzwords that enter the community, language, market and drive businesses and companies forward. That’s why we have prepared a list of the most prominent businessintelligence buzzwords that will dominate in 2020.
You ’re building an enterprise data platform for the first time in Sevita’s history. When I joined in July 2022, the company had spent the prior 24 months completing more than 20 acquisitions, and the IT team was busy bringing all these new systems online. We knew we had to bring the data together in an enterprise data platform.
Amazon DataZone now launched authentication supports through the Amazon Athena JDBC driver, allowing data users to seamlessly query their subscribed data lake assets via popular businessintelligence (BI) and analytics tools like Tableau, Power BI, Excel, SQL Workbench, DBeaver, and more.
For CIOs leading enterprise transformations, portfolio health isnt just an operational indicator its a real-time pulse on time-to-market and resilience in a digital-first economy. In todays digital-first economy, enterprise architecture must also evolve from a control function to an enablement platform.
Almost all the major software companies are continuously making use of the leading BusinessIntelligence (BI) and Data discovery tools available in the market to take their brand forward. Let us take a look into the individual concepts of social and collaborative businessintelligence to learn more about how they help companies.
This makes it possible to create dynamic, graphical user interfaces that visually represent complex information. and immediately receive relevant answers and visualizations. One example of this would be an application that helps users process complex visual content and prepare it in text or speech.
Businessintelligence definition Businessintelligence (BI) is a set of strategies and technologies enterprises use to analyze business information and transform it into actionable insights that inform strategic and tactical business decisions.
With data increasingly vital to business success, businessintelligence (BI) continues to grow in importance. With a strong BI strategy and team, organizations can perform the kinds of analysis necessary to help users make data-driven business decisions. Top 9 businessintelligence certifications.
Domo is best known as a businessintelligence (BI) and analytics software provider, thanks to its functionality for visualization, reporting, data science and embedded analytics. Domos platform addresses the full breadth of an enterprises analytics needs. Workspaces is in alpha testing. Regards, Matt Aslett
BI projects aren’t just for the big fishes in the sea anymore; the technology has developed rapidly, the software has become more accessible while businessintelligence and analytics projects implemented in various industries regularly, no matter the shape and size, small businesses or large enterprises.
As the use of intelligence technologies is staggering, knowing the latest trends in businessintelligence is a must. The market for businessintelligence services is expected to reach $33.5 top 5 key platforms that control the future of businessintelligence impacts BI may have on your business in the future.
Introduction QlikView is a popular enterprise discovery platform that enables all users in an organization to perform self-service BI. With QlikView, you can analyze and visualize data and their relationships and use these analyzes to make decisions. This article was published as a part of the Data Science Blogathon.
Rapidminer is a visualenterprise data science platform that includes data extraction, data mining, deep learning, artificial intelligence and machine learning (AI/ML) and predictive analytics. It can support AI/ML processes with data preparation, model validation, results visualization and model optimization.
Businessintelligence (BI) analysts transform data into insights that drive business value. What does a businessintelligence analyst do? The role is becoming increasingly important as organizations move to capitalize on the volumes of data they collect through businessintelligence strategies.
One of the biggest advantages is that big data helps companies utilize businessintelligence. Companies are finding more creative ways to employ data analytics to improve their businessintelligence strategies. It is one of the biggest reasons that the market for big data is projected to be worth $273 billion by 2026.
Customer relationship management ( CRM ) software provider Salesforce has updated its agentic AI platform, Agentforce , to make it easier for enterprises to build more efficient agents faster and deploy them across a variety of systems or workflows. Christened Agentforce 2.0, New agent skills in Agentforce 2.0
Amazon DataZone recently announced the expansion of data analysis and visualization options for your project-subscribed data within Amazon DataZone using the Amazon Athena JDBC driver. When you’re connected, you can query, visualize, and share data—governed by Amazon DataZone—within Tableau.
With dynamic features and a host of interactive insights, a business dashboard is the key to a more prosperous, intelligentbusiness future. Here, we explore enterprise dashboards in more detail, looking at the benefits of corporate dashboard software as well as a mix of real industry examples. 1) CFO dashboard.
The BI (businessintelligence) analysts need to find the right data for their visualization packages, business questions, and decision support tools — they also need the outputs from the data scientists’ models, such as forecasts, alerts, classifications, and more. Insights discovery for everyone is achieved.
If utilized correctly, data offers a wealth of opportunity to individuals and companies looking to improve their business’ intelligence, operational efficiency, profitability, and growth over time. In fact, we create around 2.5 This reduces the reliance on software developers or IT personnel for simple analysis and reporting.
The secret is out, and has been for a while: In order to remain competitive, businesses of all sizes, from startup to enterprise, need businessintelligence (BI). But what do you do with all this businessintelligence? This is where the power of business dashboards comes into play.
From a single solution, organizations can embed cost-effective AI, interactive data visualizations, dashboards, and reports, enhancing the value and engagement of any application RALEIGH, N.C. The process is complex, requiring a high degree of customization and extensive experience preparing and accessing data for analysis.
Here we take the time to define business report, explore visual report examples, and look at how to write one for various needs, goals, and objectives. In the process, we will use an online data visualization software that lets us interact with, and drill deeper into bits and pieces of relevant data. Let’s get started.
Executive leaders of small businesses and startups frequently lament that they lack the same access to data and insights that enterprise competitors and other more entrenched players enjoy. The solution: businessintelligence tools While mindset is a difficult obstacle to overcome, technology and budget are easier ones to surmount.
By leveraging the wealth of digital insights available at your fingertips and embracing the power of businessintelligence , it’s possible to make more informed decisions that will lead to commercial growth, evolution, and an increased bottom line. Data driven business decisions make or break companies. 2) Define objectives.
With digital operating models altering business processes and the IT landscape, enterprise architecture (EA) — a rigid stalwart of IT — has shown signs of evolving as well. EAM starts from the business outcomes and manifests into a series of investment opportunities that have a clear line of sight for delivering them.
Every enterprise needs a data strategy that clearly defines the technologies, processes, people, and rules needed to safely and securely manage its information assets and practices. Guan believes that having the ability to harness data is non-negotiable in today’s business environment.
Additionally, you want to clarify these questions regarding data analysis now or as soon as possible – which will make your future businessintelligence much clearer. Think about it like this: your goal with businessintelligence is to see reality clearly so that you can make profitable decisions to help your company thrive.
Exciting and futuristic, the concept of computer vision is based on computing devices or programs gaining the ability to extract detailed information from visual images. Visual analytics: Around three million images are uploaded to social media every single day. Artificial Intelligence (AI). Blockchain.
GAMWIT , a SaaS solution built by BizAcuity empowers game developers with powerful visual analytics. Evolution from MS Excel to Visual Reporting. Integrated data capture and visual analytics is not possible with Excel. Modern Visual Analytics Tools. Working with Excel has a couple of disadvantages. Conclusion.
We may look back at 2024 as the year when LLMs became mainstream, every enterprise SaaS added copilot or virtual assistant capabilities, and many organizations got their first taste of agentic AI. AI at Wharton reports enterprises increased their gen AI investments in 2024 by 2.3
From IT, to finance, marketing, engineering, and more, AI advances are causing enterprises to re-evaluate their traditional approaches to unlock the transformative potential of AI. What can enterprises learn from these trends, and what future enterprise developments can we expect around generative AI?
Agentic AI is the new frontier in AI evolution, taking center stage in todays enterprise discussion. Agentic AIs future in the enterprise In the enterprise, AI agents will go from assistants to decision-makers predicting problems, taking action, and continuously optimizing operations, says Akamais Prouty.
It provides better data storage, data security, flexibility, improved organizational visibility, smoother processes, extra data intelligence, increased collaboration between employees, and changes the workflow of small businesses and large enterprises to help them make better decisions while decreasing costs. Security issues.
The rise of SaaS businessintelligence tools is answering that need, providing a dynamic vessel for presenting and interacting with essential insights in a way that is digestible and accessible. To work effectively, big data requires a large amount of high-quality information sources. Where is all of that data going to come from?
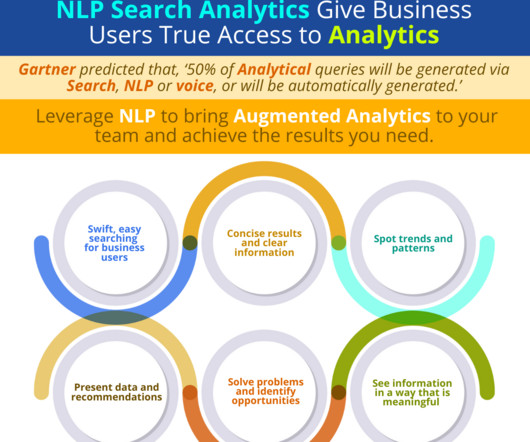
When an enterprise wishes to implement augmented analytics and businessintelligence, and make these tools available to its business user community, it must select a solution that uses natural language processing (NLP) search capabilities to allow business users with average technical skills to gather and analyze data and achieve results.
We organize all of the trending information in your field so you don't have to. Join 42,000+ users and stay up to date on the latest articles your peers are reading.
You know about us, now we want to get to know you!
Let's personalize your content
Let's get even more personalized
We recognize your account from another site in our network, please click 'Send Email' below to continue with verifying your account and setting a password.


Let's personalize your content