This site uses cookies to improve your experience. To help us insure we adhere to various privacy regulations, please select your country/region of residence. If you do not select a country, we will assume you are from the United States. Select your Cookie Settings or view our Privacy Policy and Terms of Use.
Cookie Settings
Cookies and similar technologies are used on this website for proper function of the website, for tracking performance analytics and for marketing purposes. We and some of our third-party providers may use cookie data for various purposes. Please review the cookie settings below and choose your preference.
Used for the proper function of the website
Used for monitoring website traffic and interactions
Cookie Settings
Cookies and similar technologies are used on this website for proper function of the website, for tracking performance analytics and for marketing purposes. We and some of our third-party providers may use cookie data for various purposes. Please review the cookie settings below and choose your preference.
Strictly Necessary: Used for the proper function of the website
Performance/Analytics: Used for monitoring website traffic and interactions
Spreadsheets no longer provide adequate solutions for a serious company looking to accurately analyze and utilize all the business information gathered. That’s where businessintelligence reporting comes into play – and, indeed, is proving pivotal in empowering organizations to collect data effectively and transform insight into action.
When encouraging these BI best practices what we are really doing is advocating for agile businessintelligence and analytics. Therefore, we will walk you through this beginner’s guide on agile businessintelligence and analytics to help you understand how they work and the methodology behind them.
Data analytics isn’t just for the Big Guys anymore; it’s accessible to ventures, organizations, and businesses of all shapes, sizes, and sectors. The power of data analytics and businessintelligence is universal. Entrepreneurs And BusinessIntelligence Challenges. Let’s get started!
Using businessintelligence and analytics effectively is the crucial difference between companies that succeed and companies that fail in the modern environment. Experience the power of BusinessIntelligence with our 14-days free trial! Why Is BusinessIntelligence So Important? The power of knowledge.
Speaker: Marius Moscovici, CEO Metric Insights & Mike Smitheman, VP Metric Insights
While the proper governance of data is clearly critical to the success of any businessintelligence organization, focusing on data governance alone is a huge mistake. Organizations continually fail to generate ROI on their governance initiatives because they are too narrow in scope.
1) What Is A BusinessIntelligence Strategy? 4) How To Create A BusinessIntelligence Strategy. Odds are you know your business needs businessintelligence (BI). In response to this increasing need for data analytics, businessintelligence software has flooded the market.
Previously, we discussed the top 19 big data books you need to read, followed by our rundown of the world’s top businessintelligence books as well as our list of the best SQL books for beginners and intermediates. Data visualization, or ‘data viz’ as it’s commonly known, is the graphic presentation of data.
“By visualizing information, we turn it into a landscape that you can explore with your eyes. 90% of the information transmitted to the brain is visual. Data visualization methods refer to the creation of graphical representations of information. That’s where data visualization comes in. A sort of information map.
The new data frontier: AI and DaaS Emmelibri uses data as a source of business, and a visualization tool like Tableau can be an important organizational choice, says Paleari.
Think your customers will pay more for data visualizations in your application? But today, dashboards and visualizations have become table stakes. Discover which features will differentiate your application and maximize the ROI of your embedded analytics. Five years ago they may have. Brought to you by Logi Analytics.
As the use of intelligence technologies is staggering, knowing the latest trends in businessintelligence is a must. The market for businessintelligence services is expected to reach $33.5 top 5 key platforms that control the future of businessintelligence impacts BI may have on your business in the future.
Introduction: What is BusinessIntelligence? BusinessIntelligence is the collection, storage, analysis, and reporting of data to make better business decisions. ” Many companies realize the power of BI to improve their business results. What are the Best Features in a BusinessIntelligence Program?
If utilized correctly, data offers a wealth of opportunity to individuals and companies looking to improve their business’ intelligence, operational efficiency, profitability, and growth over time. In fact, we create around 2.5 This reduces the reliance on software developers or IT personnel for simple analysis and reporting.
Soon businesses of all sizes will have so much amount of information that dashboard software will be the most invaluable resource a company can have. Visualizing the data and interacting on a single screen is no longer a luxury but a business necessity. They provide ROI by quickly highlighting trends and dig out irregularities.
Additionally, you want to clarify these questions regarding data analysis now or as soon as possible – which will make your future businessintelligence much clearer. Or even better: “Which marketing campaign that I did this quarter got the best ROI, and how can I replicate its success?”. Giving the most ROI?
Digital dashboards not only help you to drill down into the insights that matter most to your business, but they also offer an interactive visual representation that assists in swifter, more informed decision-making as well as the discovery of priceless new insights. Try our professional dashboard software for 14 days, completely free!
Management reporting is a source of businessintelligence that helps business leaders make more accurate, data-driven decisions. To answer these questions, you will need a financial management report, focused not on legal requirements, but business-level, and decision-making ones.
More generally, low-quality data can impact productivity, bottom line, and overall ROI. No, its ultimate goal is to increase return on investment (ROI) for those business segments that depend upon data. Industry-wide, the positive ROI on quality data is well understood. Data Quality Management Best Practices.
What is one strategic businessintelligence (BI) mechanism that is absolutely necessary in the digital age? Thanks to specific businessintelligence best practices for dashboard design. They are basically a tech-driven approach used to analyze and visualize information in an actionable way. An online BI dashboard.
By using online data visualization tools such as interactive dashboards you can tell a story with your data and extract advanced insights to support your work when presenting it to clients. Businessintelligence tools allow agencies to extract data from several sources into one place with just a few clicks. click to enlarge**.
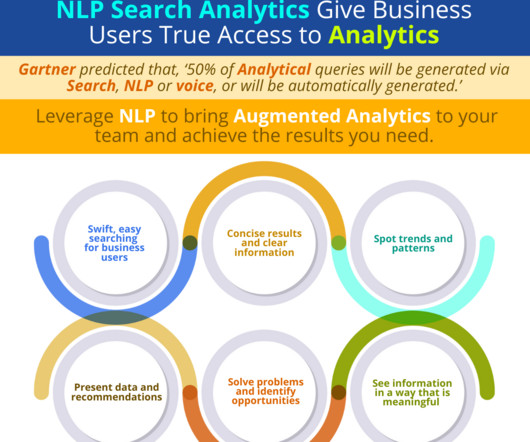
When an enterprise wishes to implement augmented analytics and businessintelligence, and make these tools available to its business user community, it must select a solution that uses natural language processing (NLP) search capabilities to allow business users with average technical skills to gather and analyze data and achieve results.
Return on investment (ROI). We hope that this detailed guide can smooth the path to selecting the right data catalog software for your businessintelligence. The quality and depth of the data lineage is paramount. Are these likely to change over time? How much will the data catalog enhance the company’s finances?
The ideal businessintelligence and analytics solution includes traditional BI features, modern BI and analytics components and a full suite of reporting capabilities that are easy for your team to use, and will produce clear, concise results for fact-based decision-making. 7 out of 10 business rate data discovery as very important.
But before we delve into examples and templates of these kinds of dashboards, we will focus on our next subject: what is a business performance dashboard? What Is A Performance Dashboard In Business? Over time, this will result in an overall improvement to your business’s efficiency in the areas that matter most. Interactivity.
More and more CRM, marketing, and finance-related tools use SaaS businessintelligence and technology, and even Adobe’s Creative Suite has adopted the model. Be it in the form of online BI tools , or an online data visualization system, a company must address where and how to store its data. Security issues.
The research looked at the increasingly broad portfolio of analytic capabilities available to enterprises – everything from traditional BusinessIntelligence (BI) capabilities like reporting and ad-hoc queries to modern visualization and data discovery capabilities as well as advanced (predictive) analytics.
This gives to that sales graph an overall sense of visual contrast which makes it much more digestible at a glance. Yes, no sales team is perfect, and you can always get better at any of these areas, but this graph will help you to identify the “low hanging fruit” where you can invest a little bit of effort to get a large ROI.
Business and Market Requirements As organizations and business users embrace analytics, the need for new types of visualization, reporting and features changes quickly. Vendors can accommodate business-specific needs and data visualization requirements without time-consuming, expensive customization.
It’s also popular amongst businesses for its simplicity and user accessibility, security, and the widespread connectivity that serves to streamline business models, resulting in maximum efficiency across the board. Artificial Intelligence (AI) technologies are becoming more widespread; it’s becoming a game-changer worth $15.7
By enabling real-time, autonomous data retrieval, analysis, and visualization through natural language queries, users can accelerate time-to-insights and reduce dependency on centralized data teams, says chief data and analytics officer Anahita Tafvizi. These areas were chosen for their clear ROI potential.
Jon Pruitt, director of IT at Hartsfield-Jackson Atlanta International Airport, and his team crafted a visualbusinessintelligence dashboard for a top executive in its Emergency Response Team to provide key metrics at a glance, including weather status, terminal occupancy, concessions operations, and parking capacity. “The
By understanding your core business goals and selecting the right key performance indicator ( KPI ) and metrics for your specific needs, you can use an information technology report sample to visualize your most valuable data at a glance, developing initiatives and making pivotal decisions swiftly and with confidence.
The application of Artificial intelligence and BusinessIntelligence in affiliate marketing has been actively discussed for quite a time. In AI it refers to computer intelligence, while in BI it is about smart decision-making in business influenced by data analysis and visualization. BusinessIntelligence.
Due to the cloud-based, platform business model, possibilities will open up not only for operations and maintenance services around core digital twin models, but for value-added digital services wrapped around these twins such as visualization, collaboration, physical and cybersecurity, data analytics, and AI-enabled preventative maintenance.
By monitoring your dependency on suppliers over a set time frame and identifying which one provides you with the right product at the right time, you can easily analyze the suppliers’ performance and conduct comparisons throughout your business. That way you can increase your ROI and ensure sustainable business development.
Marketers use data the company collects to strategize and monitor the effectiveness of different campaigns so they can increase ROI (return on investment) and create more revenue for the company. Another key benefit is that it allows companies to create data visualizations! It works with a number of different databases. RapidMiner.
The Use and Benefits of Low-Code No-Code Development in BusinessIntelligence (BI) and Predictive Analytics Solutions Introduction In this article, we will discuss Low-Code and No-Code Development (LCNC) and the use of the Low Code and No Code approach for businessintelligence (BI) tools and predictive analytics solutions.
Similarly, it’s becoming a powerful way to distribute data and information in businessintelligence initiatives. Several businessintelligence vendors even promote storytelling as a needed component of data discovery. And therein lies your buried treasure or ROI. asked a tribe member.
In this article, we will discuss Mobile BusinessIntelligence, also known as Mobile BI. This article will help businesses to understand the value of a mobile BI approach, and Mobile BusinessIntelligence best practices. Let’s start by answering the question, ‘ what is mobile BI ?’
It took us about six months to do the proof of concept for three different business units, but it was highly successful. In fact, the ROI was so high, we gained the trust of our executives to invest in a platform to begin centralizing data.” BusinessIntelligence, CIO, Digital Transformation, Enterprise Architecture, IT Leadership
And you can’t risk false starts or delayed ROI that reduces the confidence of the business and taint this transformational initiative. With all these diverse metadata sources, it is difficult to understand the complicated web they form much less get a simple visual flow of data lineage and impact analysis.
That content will include stories in which users communicate business information through a combination of business data and visuals, and widgets, the visual elements such as charts and tables used to tell stories. But it’s not just about productivity.
Without it, businesses incur steep costs, but the downside, or costs, are often unclear because calculating data management’s return on investment (ROI), or upside, is a murky exercise. For many organizations, the real challenge is quantifying the ROI benefits of data management in terms of dollars and cents.
Modern executive reporting consolidates key business metrics while outlining problems and solutions in which KPI dashboards are used to provide additional insights and serve as an added visual representation that usually lacks in executive reports and summaries. 90% of the information transmitted to the brain is visual.
We organize all of the trending information in your field so you don't have to. Join 42,000+ users and stay up to date on the latest articles your peers are reading.
You know about us, now we want to get to know you!
Let's personalize your content
Let's get even more personalized
We recognize your account from another site in our network, please click 'Send Email' below to continue with verifying your account and setting a password.


Let's personalize your content