This site uses cookies to improve your experience. To help us insure we adhere to various privacy regulations, please select your country/region of residence. If you do not select a country, we will assume you are from the United States. Select your Cookie Settings or view our Privacy Policy and Terms of Use.
Cookie Settings
Cookies and similar technologies are used on this website for proper function of the website, for tracking performance analytics and for marketing purposes. We and some of our third-party providers may use cookie data for various purposes. Please review the cookie settings below and choose your preference.
Used for the proper function of the website
Used for monitoring website traffic and interactions
Cookie Settings
Cookies and similar technologies are used on this website for proper function of the website, for tracking performance analytics and for marketing purposes. We and some of our third-party providers may use cookie data for various purposes. Please review the cookie settings below and choose your preference.
Strictly Necessary: Used for the proper function of the website
Performance/Analytics: Used for monitoring website traffic and interactions
With the ability to browse metadata, you can understand the structure and schema of the data source, identify relevant tables and fields, and discover useful data assets you may not be aware of.
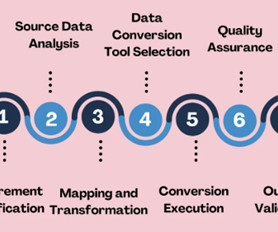
Selecting the strategies and tools for validating datatransformations and data conversions in your data pipelines. Introduction Datatransformations and data conversions are crucial to ensure that raw data is organized, processed, and ready for useful analysis.
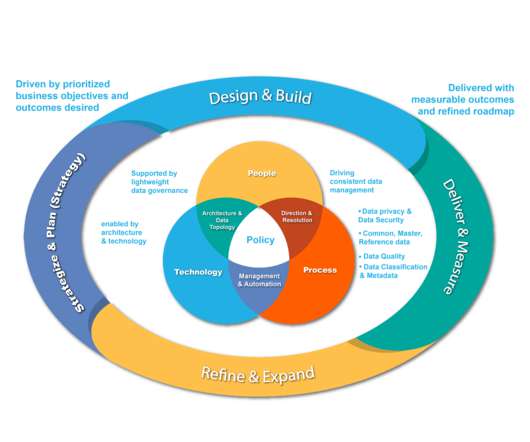
Today we will share our approach to developing a data governance program to drive datatransformation and fuel a data-driven culture. Data governance is a crucial aspect of managing an organization’s data assets.
This initial phase focuses on understanding the business value-add from a business perspective, then translating this knowledge into a data mining problem definition. This may also involve the generation of a preliminary plan designed to deliver the businessobjectives. What are we trying to achieve?
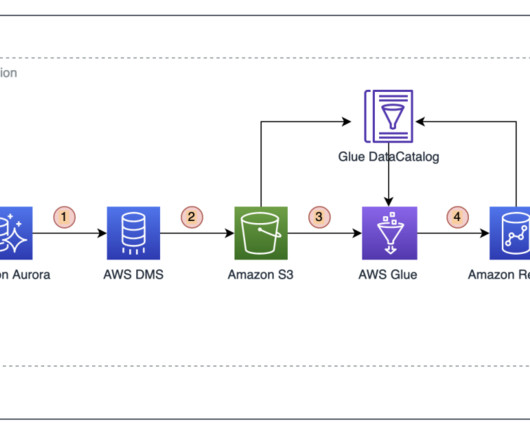
Components of the consumer application The consumer application comprises three main parts that work together to consume, transform, and load messages from Amazon MSK into a target database. The following diagram shows an example of datatransformations in the handler component. Younggu Yun works at AWS Data Lab in Korea.
With the ever-increasing volume of data available, Dafiti faces the challenge of effectively managing and extracting valuable insights from this vast pool of information to gain a competitive edge and make data-driven decisions that align with company businessobjectives.
Used effectively, it focuses budget discussions on why a specific staffing plan is necessary to achieve businessobjectives rather than negotiating a percentage change in the budget. This can save budget owners time and shorten planning cycles. In this respect, it supports a zero-based budgeting approach.
This is especially beneficial when teams need to increase data product velocity with trust and data quality, reduce communication costs, and help data solutions align with businessobjectives. Rather, they become part of the self-serve platform supporting data mesh for the storage and compute needs of each node.
However, you might face significant challenges when planning for a large-scale data warehouse migration. Additionally, organizations must carefully consider factors such as cost implications, security and compliance requirements, change management processes, and the potential disruption to existing business operations during the migration.
Furthermore, these tools boast customization options, allowing users to tailor data sources to address areas critical to their business success, thereby generating actionable insights and customizable reports. Best BI Tools for Data Analysts 3.1 Key Features: Extensive library of pre-built connectors for diverse data sources.
We could give many answers, but they all centre on the same root cause: most data leaders focus on flashy technology and symptomatic fixes instead of approaching datatransformation in a way that addresses the root causes of data problems and leads to tangible results and business success. And that’s important.
Both of these concepts resonated with our team and our objectives, and so we found ourselves supporting both to some extent. Looking at the diagram, we see that Business Intelligence (BI) is a collection of analytical methods applied to big data to surface actionable intelligence by identifying patterns in voluminous data.
The update is to drop and re-import the same graph data into a single atomic transaction. In use cases when the named graph has other meanings or the granularity of the updates is smaller like on the businessobject level, the user can design an explicit DELETE/INSERT template.
This concludes creating data sources on the AWS Glue job canvas. Next, we add transformations by combining data from these different tables. Transform the data Complete the following steps to add datatransformations: On the AWS Glue job canvas, choose the plus sign. Sumitha AP is a Sr.
By uncovering the data that truly drives your business, we enable you to focus your efforts where they matter most. For example, we worked with a global medical devices manufacturer to streamline their datatransformation by identifying their most critical data assets and placing a value on them.
We organize all of the trending information in your field so you don't have to. Join 42,000+ users and stay up to date on the latest articles your peers are reading.
You know about us, now we want to get to know you!
Let's personalize your content
Let's get even more personalized
We recognize your account from another site in our network, please click 'Send Email' below to continue with verifying your account and setting a password.


Let's personalize your content