This site uses cookies to improve your experience. To help us insure we adhere to various privacy regulations, please select your country/region of residence. If you do not select a country, we will assume you are from the United States. Select your Cookie Settings or view our Privacy Policy and Terms of Use.
Cookie Settings
Cookies and similar technologies are used on this website for proper function of the website, for tracking performance analytics and for marketing purposes. We and some of our third-party providers may use cookie data for various purposes. Please review the cookie settings below and choose your preference.
Used for the proper function of the website
Used for monitoring website traffic and interactions
Cookie Settings
Cookies and similar technologies are used on this website for proper function of the website, for tracking performance analytics and for marketing purposes. We and some of our third-party providers may use cookie data for various purposes. Please review the cookie settings below and choose your preference.
Strictly Necessary: Used for the proper function of the website
Performance/Analytics: Used for monitoring website traffic and interactions
This article was published as a part of the Data Science Blogathon. Introduction Consider the following scenario: you are a product manager who wants to categorize customer feedback into two categories: favorable and unfavorable.
Announcing DataOps Data Quality TestGen 3.0: Open-Source, Generative Data Quality Software. It assesses your data, deploys production testing, monitors progress, and helps you build a constituency within your company for lasting change. Imagine an open-source tool thats free to download but requires minimal time and effort.
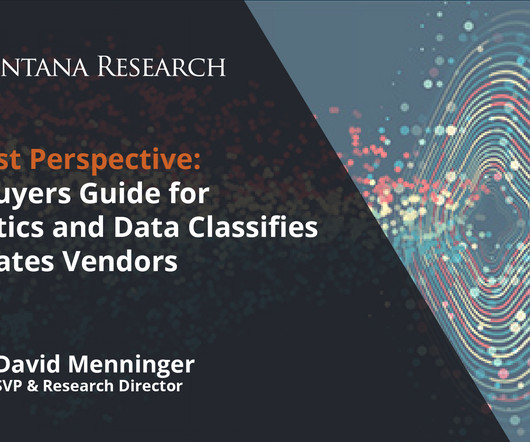
Drawing on our Benchmark Research, we apply a structured methodology built on evaluation categories that reflect the real-world criteria incorporated in a request for proposal to Analytics and Data vendors supporting the spectrum of Augmented Analytics.
Unlocking Data Team Success: Are You Process-Centric or Data-Centric? Over the years of working with data analytics teams in large and small companies, we have been fortunate enough to observe hundreds of companies. We want to share our observations about data teams, how they work and think, and their challenges.
In our previous article, What You Need to Know About Product Management for AI , we discussed the need for an AI Product Manager. In this article, we shift our focus to the AI Product Manager’s skill set, as it is applied to day to day work in the design, development, and maintenance of AI products. The AI Product Pipeline.
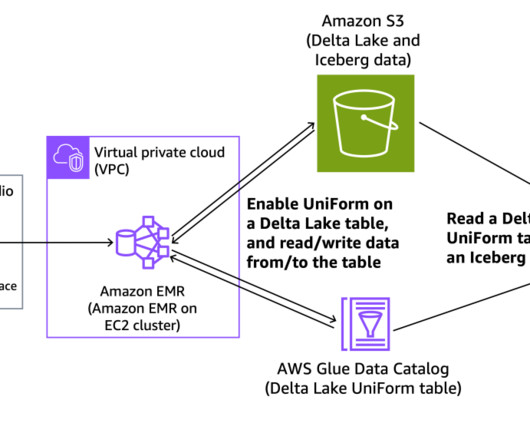
The landscape of big datamanagement has been transformed by the rising popularity of open table formats such as Apache Iceberg, Apache Hudi, and Linux Foundation Delta Lake. These formats, designed to address the limitations of traditional data storage systems, have become essential in modern data architectures.
The Ventana Research Value Index: Analytics and Data 2021 is the distillation of a year of market and product research by Ventana Research. Using this methodology, we evaluated vendor submissions in seven categories: five relevant to the product experience ? adaptability, capability, manageability, reliability and usability ?
We utilized a structured research methodology that includes evaluation categories designed to reflect the breadth of the real-world criteria incorporated in a request for proposal (RFP) and vendor selection process for analytics and business intelligence.
ERP operations are more streamlined and easier to manage, she says. Frankly, from my seat as CIO, its a single team to manage the system. IBM placed in the leader category for SAP services, which is the topmost category for a Forrester Wave evaluation, she says. Thats systems consolidation.
Amazon Redshift is a fast, fully managed cloud data warehouse that makes it cost-effective to analyze your data using standard SQL and business intelligence tools. Customers use data lake tables to achieve cost effective storage and interoperability with other tools. The sample files are ‘|’ delimited text files.
We utilized a structured research methodology that includes evaluation categories designed to reflect the breadth of the real-world criteria incorporated in a request for proposal (RFP) and vendor selection process for analytics and business intelligence.
Whether it’s controlling for common risk factors—bias in model development, missing or poorly conditioned data, the tendency of models to degrade in production—or instantiating formal processes to promote data governance, adopters will have their work cut out for them as they work to establish reliable AI production lines.
However, technology is increasingly helping midsize enterprises close that gap and achieve higher levels of management effectiveness. Enterprise resource planning systems have been the central nervous system of enterprises for more than three decades, handling business-critical process management and recordkeeping.
I previously explained that data observability software has become a critical component of data-driven decision-making. Data observability addresses one of the most significant impediments to generating value from data by providing an environment for monitoring the quality and reliability of data on a continual basis.
Visualizing the data and interacting on a single screen is no longer a luxury but a business necessity. A professional dashboard maker enables you to access data on a single screen, easily share results, save time, and increase productivity. That’s why we welcome you to the world of interactive dashboards.
As with many burgeoning fields and disciplines, we don’t yet have a shared canonical infrastructure stack or best practices for developing and deploying data-intensive applications. The new category is often called MLOps. Why: Data Makes It Different. Can’t we just fold it into existing DevOps best practices?
Supply chain management (SCM) is a critical focus for companies that sell products, services, hardware, and software. Optimizing the supply chain with AI AI is quickly being implemented across industries with the goal to improve efficiency and productivity, and supply chain management is no exception. was released in 2017 by the ASCM.
In todays economy, as the saying goes, data is the new gold a valuable asset from a financial standpoint. A similar transformation has occurred with data. More than 20 years ago, data within organizations was like scattered rocks on early Earth.
The rise of innovative, interactive, data-driven dashboard tools has made creating effective dashboards – like the one featured above – swift, simple, and accessible to today’s forward-thinking businesses. Dashboard design should be the cherry on top of your business intelligence (BI) project. Now, it’s time for the fun part.
While NIST released NIST-AI- 600-1, Artificial Intelligence Risk Management Framework: Generative Artificial Intelligence Profile on July 26, 2024, most organizations are just beginning to digest and implement its guidance, with the formation of internal AI Councils as a first step in AI governance.So
In todays data-driven world, tracking and analyzing changes over time has become essential. As organizations process vast amounts of data, maintaining an accurate historical record is crucial. History management in data systems is fundamental for compliance, business intelligence, data quality, and time-based analysis.
Amazon Redshift is a fully managed, AI-powered cloud data warehouse that delivers the best price-performance for your analytics workloads at any scale. It provides a conversational interface where users can submit queries in natural language within the scope of their current data permissions. Choose Query data.
The release goes on to say that DHS identified three primary categories of AI safety and security vulnerabilities in critical infrastructure: “attacks using AI, attacks targeting AI systems, and design and implementation failures. Hopefully, we will see this framework continue to evolve.”
It’s also the data source for our annual usage study, which examines the most-used topics and the top search terms. [1]. This year’s growth in Python usage was buoyed by its increasing popularity among data scientists and machine learning (ML) and artificial intelligence (AI) engineers. A drill-down into data, AI, and ML topics.
We suspected that data quality was a topic brimming with interest. The responses show a surfeit of concerns around data quality and some uncertainty about how best to address those concerns. Key survey results: The C-suite is engaged with data quality. Data quality might get worse before it gets better.
In June 2021, we asked the recipients of our Data & AI Newsletter to respond to a survey about compensation. The average salary for data and AI professionals who responded to the survey was $146,000. We didn’t use the data from these respondents; in practice, discarding this data had no effect on the results.
On-prem data sources have the powerful advantage (for design, development, and deployment of enterprise analytics applications) of low-latency data delivery. Low-latency data delivery is a system level requirement that is tied to a critical business user requirement: low-latency analytics product delivery !
Exclusive Bonus Content: Download Data Implementation Tips! A dashboard in business is a tool used to manage all the business information from a single point of access. It helps managers and employees to keep track of the company’s KPIs and utilizes business intelligence to help companies make data-driven decisions.
This is not surprising given that DataOps enables enterprise data teams to generate significant business value from their data. Companies that implement DataOps find that they are able to reduce cycle times from weeks (or months) to days, virtually eliminate data errors, increase collaboration, and dramatically improve productivity.
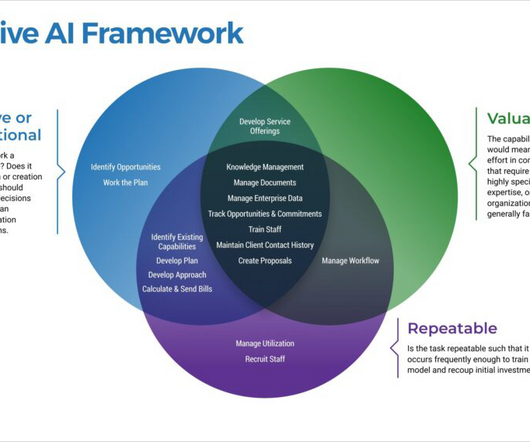
In this post, we will examine ways that your organization can separate useful content into separate categories that amplify your own staff’s performance. Specifically, in the modern era of massive data collections and exploding content repositories, we can no longer simply rely on keyword searches to be sufficient.
Broadcom and Google Clouds continued commitment to solving our customers most pressing challenges stems from our joint goal to enable every organizations ability to digitally transform through data-powered innovation with the highly secure and cyber-resilient infrastructure, platform, industry solutions and expertise.
These required specialized roles and teams to collect domain-specific data, prepare features, label data, retrain and manage the entire lifecycle of a model. Companies can enrich these versatile tools with their own data using the RAG (retrieval-augmented generation) architecture. An LLM can do that too.
In our cutthroat digital age, the importance of setting the right data analysis questions can define the overall success of a business. That being said, it seems like we’re in the midst of a data analysis crisis. Your Chance: Want to perform advanced data analysis with a few clicks? Data Is Only As Good As The Questions You Ask.
While customers can perform some basic analysis within their operational or transactional databases, many still need to build custom data pipelines that use batch or streaming jobs to extract, transform, and load (ETL) data into their data warehouse for more comprehensive analysis. or a later version) database.
3) The Role Of Data Drilling In Reporting. It is no secret that the business world is becoming more data-driven by the minute. Every day, more and more decision-makers rely on data coming from multiple sources to make informed strategic decisions. In general, data drills can be added to any chart or data visualization.
2024 Gartner Market Guide To DataOps We at DataKitchen are thrilled to see the publication of the Gartner Market Guide to DataOps, a milestone in the evolution of this critical software category. It handles connector management and workflow impact analysis and maintains audit logs.
Not to be extra confusing, but the category is sometimes called conversational AI.) It means automating the delivery of interaction data to analytics systems that reside outside the contact center, where marketers can orchestrate experiences based on targeted segments and audiences built on contextual cues like sentiment and advocacy.
2) Charts And Graphs Categories 3) 20 Different Types Of Graphs And Charts 4) How To Choose The Right Chart Type Data and statistics are all around us. That is because graphical representations of data make it easier to convey important information to different audiences. Below we will discuss the graph and chart categories.
One sure sign that companies are getting serious about machine learning is the growing popularity of tools designed specifically for managing the ML model development lifecycle, such as MLflow and Comet.ml. Quality depends not just on code, but also on data, tuning, regular updates, and retraining. Source: Ben Lorica.
Third, any commitment to a disruptive technology (including data-intensive and AI implementations) must start with a business strategy. These changes may include requirements drift, data drift, model drift, or concept drift. A business-disruptive ChatGPT implementation definitely fits into this category: focus first on the MVP or MLP.
Traditionally, financial data analysis could require deep SQL expertise and database knowledge. Now with Amazon Bedrock Knowledge Bases integration with structured data, you can use simple, natural language prompts to query complex financial datasets. or Give me details of all accounts for a specific customer.
Enterprise data is brought into data lakes and data warehouses to carry out analytical, reporting, and data science use cases using AWS analytical services like Amazon Athena , Amazon Redshift , Amazon EMR , and so on. Choose Manage model access. Change the AWS Region to US West (Oregon).
1) What Is Data Interpretation? 2) How To Interpret Data? 3) Why Data Interpretation Is Important? 4) Data Analysis & Interpretation Problems. 5) Data Interpretation Techniques & Methods. 6) The Use of Dashboards For Data Interpretation. Business dashboards are the digital age tools for big data.
We organize all of the trending information in your field so you don't have to. Join 42,000+ users and stay up to date on the latest articles your peers are reading.
You know about us, now we want to get to know you!
Let's personalize your content
Let's get even more personalized
We recognize your account from another site in our network, please click 'Send Email' below to continue with verifying your account and setting a password.


Let's personalize your content