This site uses cookies to improve your experience. To help us insure we adhere to various privacy regulations, please select your country/region of residence. If you do not select a country, we will assume you are from the United States. Select your Cookie Settings or view our Privacy Policy and Terms of Use.
Cookie Settings
Cookies and similar technologies are used on this website for proper function of the website, for tracking performance analytics and for marketing purposes. We and some of our third-party providers may use cookie data for various purposes. Please review the cookie settings below and choose your preference.
Used for the proper function of the website
Used for monitoring website traffic and interactions
Cookie Settings
Cookies and similar technologies are used on this website for proper function of the website, for tracking performance analytics and for marketing purposes. We and some of our third-party providers may use cookie data for various purposes. Please review the cookie settings below and choose your preference.
Strictly Necessary: Used for the proper function of the website
Performance/Analytics: Used for monitoring website traffic and interactions
Respondents seemed concerned about job security, probably because of the pandemic’s effect on the economy. The results gave us insight into what our subscribers are paid, where they’re located, what industries they work for, what their concerns are, and what sorts of career development opportunities they’re pursuing. Executive Summary.
My exact score is lost to history, but one of the doctors in the room tells me it was probably a six or less out of ten. And yet a number or category label that describes a human life is not only machine-readable data. You get two points for waving your arms and legs, for instance.) Numbers like that typically mean a baby needs help.
Machine learning solutions for data integration, cleaning, and data generation are beginning to emerge. “AI AI starts with ‘good’ data” is a statement that receives wide agreement from data scientists, analysts, and business owners. As model building become easier, the problem of high-quality data becomes more evident than ever.
It is not just important to gather all the existing information, but to consider the preparation of data and utilize it in the proper way, has become an indispensable value in developing a successful business strategy. That being said, it seems like we’re in the midst of a data analysis crisis. Today, big data is about business disruption.
Probably not, but only time will tell. O’Reilly online learning contains information about the trends, topics, and issues tech leaders need to watch and explore. It’s also the data source for our annual usage study, which examines the most-used topics and the top search terms. [1]. Coincidence? ML + AI are up, but passions have cooled.
Data science needs knowledge from a variety of fields including statistics, mathematics, programming, and transforming data. Mathematics, statistics, and programming are pillars of data science. In data science, use linear algebra for understanding the statistical graphs. Probability. Probability distributions.
The categories are usually qualitative data such as products, years, product categories, countries, etc. Plus, they have enough space to plot as many categories as you need without cluttering the graph, making them way more efficient than column charts when it comes to analyzing multiple categories of data.
In 2019, I was asked to write the Foreword for the book “ Graph Algorithms: Practical Examples in Apache Spark and Neo4j “ , by Mark Needham and Amy E. I wrote an extensive piece on the power of graph databases, linked data, graph algorithms, and various significant graph analytics applications. Graph Algorithms book.
2) Charts And Graphs Categories 3) 20 Different Types Of Graphs And Charts 4) How To Choose The Right Chart Type Data and statistics are all around us. That said, there is still a lack of charting literacy due to the wide range of visuals available to us and the misuse of statistics. What Are Graphs And Charts?
Almost everybody’s played with ChatGPT, Stable Diffusion, GitHub Copilot, or Midjourney. A few have even tried out Bard or Claude, or run LLaMA 1 on their laptop. And everyone has opinions about how these language models and art generation programs are going to change the nature of work, usher in the singularity, or perhaps even doom the human race.
Predictive analytics definition Predictive analytics is a category of data analytics aimed at making predictions about future outcomes based on historical data and analytics techniques such as statistical modeling and machine learning. billion in 2022, according to a research study published by The Insight Partners in August 2022.
Machine Learning is Crucial for Success in Digital Marketing If you have a Spotify or Netflix account, you have probably noticed a trend. When you watch or listen to something one day, the next day you will have a whole category of recommendations from the same genre as your most played or watched. No worries, we will show you how.
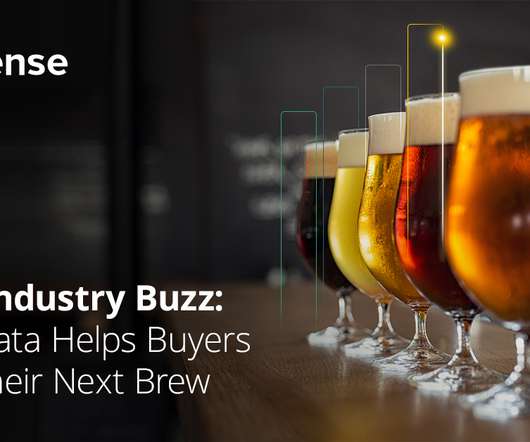
Using beer sales statistics to understand the consumer. Using beer sales statistics to understand the consumer. RetailZoom analyzed beer sales statistics gathered from 95% of the supermarkets in its native Cyprus. Beer culture has risen in the US and worldwide, with over a half-trillion USD in sales annually ?—
This is where marketing teams will probably spend much of their time, as finding the right prompt to generate the optimal messaging to customers is very much a combination of art and science. The company has been a leader in organizing the details of the relationship between businesses and their customers. What is Einstein 1 Studio?
The fundamental categories that differentiate these questions are based on: Relationship. Modern dashboard software makes it simpler than ever to merge and visualize data in a way that’s as inspiring as it is accessible. But while doing so is easy, a great dashboard still requires a certain amount of strategic planning and design thinking.
When companies first start deploying artificial intelligence and building machine learning projects, the focus tends to be on theory. Is there a model that can provide the necessary results? How can it be built? How can it be trained? This is where MLOps comes in. MLOps brings model velocity down to weeks — sometimes days,” says Subramanian.
When companies first start deploying artificial intelligence and building machine learning projects, the focus tends to be on theory. Is there a model that can provide the necessary results? How can it be built? How can it be trained? This is where MLOps comes in. MLOps brings model velocity down to weeks — sometimes days,” says Subramanian.
The good news is that if you are passionate about data and have the skills to back it up, you can probably find a challenging, rewarding role. We live in a constantly-evolving world of data. That means that jobs in data big data and data analytics abound. The wide variety of data titles can be dizzying and confusing! Data Scientist.
A sobering statistic if ever we saw one. The restaurant industry is one of the most competitive sectors on the planet. Not only do we as a species need to eat and drink to survive; communal dining is an experience that people have cherished for centuries. But shockingly, 50,000 restaurant locations close their doors each year.
by THOMAS OLAVSON Thomas leads a team at Google called "Operations Data Science" that helps Google scale its infrastructure capacity optimally. ln this post he describes where and how having “humans in the loop” in forecasting makes sense, and reflects on past failures and successes that have led him to this perspective.
With a shocking 2.5 quintillion bytes of data being produced on a daily basis and the wide range of online data analysis tools in the market, the use of data and analytics has never been more accessible. However, with all good things comes many challenges and businesses often struggle with managing their information in the correct way.
The statistics app for Google Sheets hopes to change that. Editor's note: We've mostly portrayed data science as statistical methods and analysis approaches based on big data. Introduction Statistics for Google Sheets is an add-on for Google Sheets that brings elementary statistical analysis tools to spreadsheet users.
We want to estimate the prevalence of violation of each individual policy category (we call them policy verticals ) by sampling the videos and manually reviewing those sampled videos. We also cover many practical challenges encountered in implementation when the requirement is to produce fresh and regular estimates of prevalence.
You’re probably tired of hearing that information is proliferating at a rate that humans can barely comprehend, let alone keep up with. As datasets become bigger and more complex, only AI, materialized views, and more sophisticated coding languages will be able to glean insights from them. The good news is, you don’t have to!
A data scientist must be skilled in many arts: math and statistics, computer science, and domain knowledge. A data scientist must be skilled in many arts: math and statistics, computer science, and domain knowledge. Statistics and programming go hand in hand. Importance of statistical techniques.
For example, with Alexa , you can report on traffic statistics (such as rank and page views), upstream (where your traffic comes from) and downstream (where people go after visiting your site) statistics, and key-words driving traffic to a site. I am just scratching the surface of what's possible. 1: Toolbar Data.
Humans show a myriad of explicit and implicit emotional signals in our behaviors. Our facial expression, posture, and even the music we listen to are types of expressions that tell the overarching story of how we feel. For this reason, signals that could help us understand ourselves and our emotions go unnoticed. you get a daunting enigma.
Continued advancement in AI development has resulted today in a definition of AI which has several categories and characteristics. The four categories of predictive modelling, robotics, speech and image recognition are collectively known as algorithm-based AI or Discriminative AI. It has taken the world by storm.
Maybe they converted from an AS/400 at some point and everything thereafter has more decimals or more values. Once you’ve documented and understood your sources, you have reached the second stage: data sloughs (note, you have more than one). Now comes the fun part: cleaning up your data. After cleaning, it’s on to organizing your data. That’s fine.
Michael, politely, says in an email: "I have done web analytics for five years, I have mastered Omniture, WebTrends and Google Analytics, I provide analysis and not just reporting. I feel like am an Analytics God. What would be your advice for me in terms of next steps for my career? My goal is to climb the ranks and increase my salary."
Categories and values (see below) are plotted on axes. Throughout I use the word “category” to refer to something discrete that is plotted on an axis, for example France, Germany, Italy and The UK, or 2016, 2017, 2018 and 2019. With a few exceptions, the Charts described below plot values against categories.
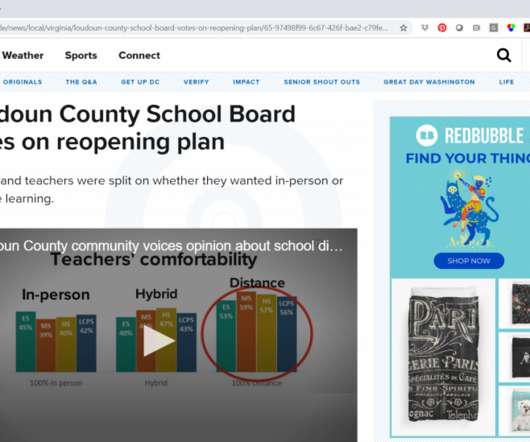
Our organizations collect all this data—through surveys, assessments, interviews, and so on— and then what? The default: The data just sits there inside a Dusty Shelf Report. But what if your data could actually inform real-life decisions? metro area. The topic was school reopening plans for the 2020-2021 academic year. Watch the Conversation Below.
Some of that uncertainty is the result of statistical inference, i.e., using a finite sample of observations for estimation. But there are other kinds of uncertainty, at least as important, that are not statistical in nature. Among these, only statistical uncertainty has formal recognition. Vignette: Data Science at fluff.ai
It’s fine to exclude them from your data or to lump them together into an “Unusual” category, but you should make sure you know why data ended up in that category. We were often asked to make sense of confusing results, measure new phenomena from logged behavior, validate analyses done by others, and interpret metrics of user behavior.
Rather, I'm going to share a clump of realities/rules garnered from the present to help ready you for the predictable near future. Now here is the great part… if you follow these rules and act on these insights I believe you'll be significantly better prepared for the unpredictable future. Awesome right? And no one deserves that.
Feature coding involves choosing a set of symbolic values to represent different categories. Many thanks to AWP Pearson for the permission to excerpt “Manual Feature Engineering: Manipulating Data for Fun and Profit” from the book, Machine Learning with Python for Everyone by Mark E. Introduction.
It attempts to simplify a topic that has more than it’s share of coolness, confusion and complexity. While the phrase Artificial Intelligence has been around since the first human wondered if she could go further if she had access to entities with inorganic intelligence, it truly jumped the shark in 2016. AI | Now | Global Maxima. Cool, right?
Product managers aren’t a new job category by any means, but this shift means that they’re newly prominent and important to many companies’ strategies. These new building blocks of business include both tech and business pros, and they’re generally led by a product manager , who acts as the point person throughout the product’s lifecycle.
The second part of the equation most frequently improves in a revolutionary manner. The challenge for Senior Leaders is that revolutions seem a lot more attractive and hence they charge full speed ahead. This results in frustration, derailed careers and a massive amount of money flushed down sad places. Evolution works. Step 1: Optimal Metrics.
Our collective understanding of realized AI and theoretical AI continues to shift, meaning AI categories and AI terminology may differ (and overlap) from one source to the next. However, the types of AI can be largely understood by examining two encompassing categories: AI capabilities and AI functionalities.
and implications of findings) than in statistical significance. Visualizing data in charts, graphs, dashboards, and infographics is one of the most powerful strategies for getting your numbers out of your spreadsheets and into real-world conversations. But it can be overwhelming to get started with data visualization.
Given the advent of the Maths & Science section, there are now seven categories into which I have split articles. Statistics & Data Science. In each category, I will pick out one or two pieces which I feel are both representative of my overall content and worth a read. Statistics & Data Science. The number ?
And just because you don't like something… how should I put it so you'll understand… oh let's try this… you not liking something is not a statistically significant sample of data ! Seems straight forward right? First I must say that I was overwhelmed by the responses (thanks!) " See the difference?
This blog post provides a concise session summary, a video, and a written transcript. Session Summary. At Rev’s “ Data Science, Past & Future” , Paco Nathan covered contextual insight into some common impactful themes over the decades that also provided a “lens” help data scientists, researchers, and leaders consider the future.
We organize all of the trending information in your field so you don't have to. Join 42,000+ users and stay up to date on the latest articles your peers are reading.
You know about us, now we want to get to know you!
Let's personalize your content
Let's get even more personalized
We recognize your account from another site in our network, please click 'Send Email' below to continue with verifying your account and setting a password.


Let's personalize your content