This site uses cookies to improve your experience. To help us insure we adhere to various privacy regulations, please select your country/region of residence. If you do not select a country, we will assume you are from the United States. Select your Cookie Settings or view our Privacy Policy and Terms of Use.
Cookie Settings
Cookies and similar technologies are used on this website for proper function of the website, for tracking performance analytics and for marketing purposes. We and some of our third-party providers may use cookie data for various purposes. Please review the cookie settings below and choose your preference.
Used for the proper function of the website
Used for monitoring website traffic and interactions
Cookie Settings
Cookies and similar technologies are used on this website for proper function of the website, for tracking performance analytics and for marketing purposes. We and some of our third-party providers may use cookie data for various purposes. Please review the cookie settings below and choose your preference.
Strictly Necessary: Used for the proper function of the website
Performance/Analytics: Used for monitoring website traffic and interactions
In our recent report examining technical debt in the age of generative AI , we explored how companies need to break their technical debt down into four categories. Breaking it down into these categories also shows the impact on the business in a way that every board member will understand.
In essence, in this post, we will explain all the details needed for dashboard reporting and creation, compare interactive vs. static reporting, and provide tips and tricks to make your business perform even better. Interactive Dashboards vs. Static Reporting. With modern reporting tools , there is no need to do so.
However, 8% of the correspondents reported decreased compensation, and 18% reported no change. This report focuses on the respondents from the US, with only limited attention paid to those from the UK. A small number of respondents (8%) reported salary decreases, and 18% reported no change.
The proposed model illustrates the data management practice through five functional pillars: Data platform; data engineering; analytics and reporting; data science and AI; and data governance. The data platform function will set up the reporting and visualization tools, while the data engineering function will centralize the curated data.
In a world with thousands of categories, millions of products and hundreds of millions of consumers, when an individual walks into a virtual storefront, a company will be able to make remarkably specific predictions. Prediction #2: Brands will differentiate and delight with Gen AI and extreme customer insight.
However, only 16% of participants in ISG’s Data Governance Benchmark Research report that data is well trusted in their organization. Enterprises As I previously explained , although data quality and data observability are closely related and complementary, they are separate product categories.
there are two answers that go hand in hand: good exploitation of your analytics, that come from the results of a market research report. Your Chance: Want to test a market research reporting software? Explore our 14 day free trial & benefit from market research reports! What Is A Market Research Report?
3) The Role Of Data Drilling In Reporting. 4) Drill Down & Drill Through Reporting Examples. From automated reporting, predictive analytics, and interactive data visualizations, reporting on data has never been easier. Your Chance: Want to start building your own interactive reports today? Table of Contents.
For example, while 45% of larger enterprises report that financial analysis is performed very well, only 29% of midsize organizations achieve that level. This shortage is causing executives to take a fresh look at software that manages the full close-consolidate-report cycle end to end.
Warnings and failures appear in logs and reports that can help the data team pinpoint problems with laser-like accuracy. Below we’ll show an actual report used by a DataOps enterprise. It helps people keep their “finger on the pulse” of what is happening, so stakeholders started calling it the “Pulse Report.”. The Pulse Report.
Nominal – you organize your data in non-numeric categories that cannot be ranked or compared quantitatively. Interval – in this type of scale, data is grouped into categories with order and equal distance between these categories. How will they apply your reports? This quote might sound a little dramatic. Who are they?
An important part of a successful business strategy is utilizing a modern data analysis tool and implementing a marketing report in its core procedures that will become the beating heart of acquiring customers, researching the market, providing detailed data insights into the most valuable information for any business: is our performance on track?
A once in a generation opportunity Mayorkas explained the need for the framework in a report outlining the initiative, “AI is already altering the way Americans interface with critical infrastructure.
Well-built, focused dashboards easily serve up summaries and reports of the BI that’s most critical to the organization. This type of analysis is not feasible with traditional paper reports and spreadsheet tools. It is important to remember that dashboards are not just reports. It also needs to deliver context! Operational.
After assessment of the source SQL files, it generates a comprehensive report that provides valuable insights into the migration effort. Review the report thoroughly, because it provides a summary and in-depth explanations of the SQL analysis. for Linux and macOS). This keeps the general rules clean and organized.
The answer is modern agency analytics reports and interactive dashboards. Starting with its definition, following with the benefits of agency reports, a list of tools, and a set of agency dashboard examples. We will then finish with 8 valuable tips to achieve a successful agency reporting process. What Are Agency Analytics?
A person who manages a data science or data engineering team—or, for that matter, a DevOps or AIOps practice—functions for all intents and purposes as an interface between her team(s) and the person (also typically a manager) to whom she directly reports. She’s “management,” but she’s still at the front line. 3 issues or 4 issues, etc.).
1) What Is Content Reporting? 3) Why Is Content Report Analysis Important? 5) Content Reporting Best Practices. Enter modern content reports. What Is Content Reporting? This is no longer the case, thanks to the introduction of modern reporting tools such as interactive dashboards. Table of Contents.
It enables organizations to maintain audit trails, perform trend analysis, identify data quality issues, and conduct point-in-time reporting. History management in data systems is fundamental for compliance, business intelligence, data quality, and time-based analysis.
The framework was modernized so best practices better align with digital strategies, including new training information and integrated sustainability standards using the Global Reporting Initiative (GRI). This level includes subtype categories that fall under the parent categories found in Level 1.
As a business, you need the reliability of frequent financial reports to gain a better grasp of your financial status, both current and future. A robust finance report communicates crucial financial information that covers a specified period through daily, weekly, and monthly financial reports. What Is A Finance Report?
OpenAI is also skimming the cream, quickly dominating some of the most profitable categories—image generation, video generation, speech synthesis, computer programming—that in a well-functioning market would be explored by dozens or hundreds of competing efforts, until one or two find the winning combination of product and business model.
Traditionally, such an application might have used a specially trained ML model to classify uploaded receipts into accounting categories, such as DATEV. For example, a report summarizing last weeks alarms, identifying recurring problems, and suggesting areas for improvement.
Hot technologies for banks also include 5G , natural language processing (NLP) , microservices architecture , and computer vision, according to Forrester’s recent Top Emerging Technologies in Banking In 2022 report. AI enhances operational efficiency. 5G aids customer service. 5G aids customer service. 5G aids customer service.
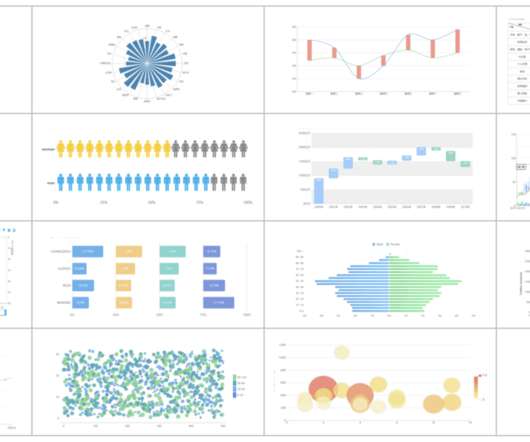
2) Charts And Graphs Categories 3) 20 Different Types Of Graphs And Charts 4) How To Choose The Right Chart Type Data and statistics are all around us. Below we will discuss the graph and chart categories. These categories will build a solid foundation that will help you pick the right visual for your analytical aims.
To achieve this, the vast majority of organizations report having to use up to five solutions across each of the following categories to enable cyber recovery: backup, cloud infrastructure, networking, disaster recovery as-a-service (DRaaS), and extended detection and response.
As of November 2023: Two-thirds (67%) of our survey respondents report that their companies are using generative AI. Two-thirds of our survey’s respondents (67%) report that their companies are using generative AI. And only 33% report that their companies aren’t using AI at all. Certainly not two-thirds of them.
1) What Are Accounting Reports? 2) Why Do You Need Accounting Reports? 3) Types Of Accounting Reports. 4) Accounting Reports Examples. 5) The Role Of Visuals In Accountant Reports. On the basis of every company’s competent management, we can find accounting reports. What Are Accounting Reports?
Free data visualization tools are professional in different categories: dashboard, chart, maps, network, and so on. FineReport is a data visualization tool free for personal use, which supports visualizing your data into reports and dashboards. . FineReport provides more than 19 categories and 50+ styles of HTML5 charts.
We are in favor of AI regulations as well as regulatory simplification, also recommended by the Draghi Report, and the effective execution of the AI Act and any new AI regulatory instruments. It will have to be done by mid-2026, which is a tight timeframe, but Cisco only sees benefits to being part of the AI Pact, Quattrocchi points out.
IBM named a Leader In the report, Forrester Research evaluated 15 digital process automation (DPA) providers against 26 criteria in three categories: Current offering, Strategy and Market presence. In addition, IBM received the highest possible score in vision, innovation and partner ecosystem in the Strategy category.
Get Reports and Updates Delivered to Your Mail Inbox. However, extracting such reports can be a cumbersome and time-consuming task. Another downside of Google Analytics reporting is one that is a bit less commonly experienced by Google Analytics users. The Affinity Categories segment the audience by their interests.
And procurement reporting is no exception to this. In this article, we will explain the basic definition of procurement reports, talk about the benefits and challenges that occur when dealing with procurement data to provide you with innovative ideas on spotting inefficiencies. What Are Procurement Reports?
As we mentioned time and time again, BI tools are used with the purpose of reporting on the current and past performance of the organization, BA tools allow you to take it a step further by helping you decide on your next steps. While BI arranges the information in easy-to-understand reports, BA takes it a bit further than reporting.
In this post, we will examine ways that your organization can separate useful content into separate categories that amplify your own staff’s performance. Before we start, I have a few questions for you. What attributes of your organization’s strategies can you attribute to successful outcomes?
While there are several different types of processes that are implemented based on individual data nature, the two broadest and most common categories are “quantitative analysis” and “qualitative analysis”. The varying scales include: Nominal Scale: non-numeric categories that cannot be ranked or compared quantitatively.
Nearly three-quarters of midsize and large companies report having a PMO, according to the 2022 State of the Project Management Office report from PM Solutions, a project management services firm. Various project management authorities offer additional categories that organizations might choose from when implementing a PMO.
This future-proof platform therefore aims to obtain more accurate figures in terms of carbon footprint for reporting and to identify the best levers to act on. Furthermore, as legal requirements and auditability are becoming increasingly demanding in this area, Elia’s tool makes it possible to maintain control over all reported data.
You will be able to make sense of all the financial data and metrics as they will be split into actionable categories and presented in an intuitive, scannable fashion, no matter the metric you need to include and analyze. For optimizing reports and detail analysis, you can check our blog article about financial report examples.
More than 70% of US legal departments across enterprises spanning various industry sectors have not made any investment towards digital transformation in the last two years, according to a joint report from The Association of Corporate Counsel (ACC) and legal-technology company Disco.
A Dot Distribution Plot visualises the data distribution across multiple categories by plotting dots along an axis. There are two variations of Dot Distribution Plot: first, the kind that plots a series of dots to compare the distributions between various categories across a single dimension.
The category “Data for Enterprise AI” awards companies from around the world that have built and deployed use cases for enterprise-scale machine learning and have industrialized AI to automate, secure, and optimize data-driven decision making and/or applications. In 2021, the finalists under this category include the following organizations.
Enterprise data is brought into data lakes and data warehouses to carry out analytical, reporting, and data science use cases using AWS analytical services like Amazon Athena , Amazon Redshift , Amazon EMR , and so on. Extracting valuable insights from massive datasets is essential for businesses striving to gain a competitive edge.
Foote does not report on any SAP certifications, but among the 579 certifications it does report on, architecture, project management, process and information security certifications remain the most valuable, commanding a pay premium of just over 8%. It is not always the newest technologies that pay the best.
We organize all of the trending information in your field so you don't have to. Join 42,000+ users and stay up to date on the latest articles your peers are reading.
You know about us, now we want to get to know you!
Let's personalize your content
Let's get even more personalized
We recognize your account from another site in our network, please click 'Send Email' below to continue with verifying your account and setting a password.


Let's personalize your content