This site uses cookies to improve your experience. To help us insure we adhere to various privacy regulations, please select your country/region of residence. If you do not select a country, we will assume you are from the United States. Select your Cookie Settings or view our Privacy Policy and Terms of Use.
Cookie Settings
Cookies and similar technologies are used on this website for proper function of the website, for tracking performance analytics and for marketing purposes. We and some of our third-party providers may use cookie data for various purposes. Please review the cookie settings below and choose your preference.
Used for the proper function of the website
Used for monitoring website traffic and interactions
Cookie Settings
Cookies and similar technologies are used on this website for proper function of the website, for tracking performance analytics and for marketing purposes. We and some of our third-party providers may use cookie data for various purposes. Please review the cookie settings below and choose your preference.
Strictly Necessary: Used for the proper function of the website
Performance/Analytics: Used for monitoring website traffic and interactions
BI consulting services play a central role in this shift, equipping businesses with the frameworks and tools to extract true value from their data. As businesses increasingly rely on data for competitive advantage, understanding how business intelligence consulting services foster data-driven decisions is essential for sustainable growth.
As enterprises continue to plan, expand, or evolve their digital transformation efforts and shifts to the cloud, many are likely relying on IT consultants or considering hiring them for help. Here are some tips for getting the most value from using IT consultants and ensuring that the engagement is successful and aligned with your objectives.
A few years ago, I had encouraged a BI Director to create a BI dashboard showing the key financial metrics of their company and to show it to the CEO. Its not that finance people dont want or need BI dashboards, its that their needs are different to say someone in sales, marketing, operations or HR.
But the problem is that single golden metrics hide valuable insights and, more often than not, drive bad behavior. Here's my proposal: If you are pushed to have a single golden metric, give it a partner. The BFF metric you find should not be one that is very far away. So, great metric. Honestly, who can blame them.
Today, many CIOs feel the same way about metrics. Metrics are only as good as their source. Too often, technology companies pay consulting or analyst firms to create metrics based on the best characteristics of their offerings,” says Judith Hurwitz, CEO of Hurwitz Strategies, an emerging technology consulting firm.
What metrics should I use? and in this post I want to share a really, really simple framework for structuring web analytics consulting contracts. The Web Analytics Consultant Quandary. BB sent this query: If I take on a consulting project then what could be expectations out of me? Use BR & CV. Definitely Y, do that.
An Operations Key Performance Indicator (KPI) or metric is a discrete measurement that a company uses to monitor and evaluate the efficiency of its day-to-day operations. Why Your Company Should Be Using Operational Metrics to Stay Competitive. This allows management to quickly make informed decisions that are backed up by data.
1) What Are Product Metrics? 2) Types Of Product Metrics. 3) Product Metrics Examples You Can Use. 4) Product Metrics Framework. The right product performance metrics will give you invaluable insights into its health, strength and weaknesses, potential issues or bottlenecks, and let you improve it greatly.
Read here how these metrics can drive your customers’ satisfaction up! Customer satisfaction metrics evaluate how the products or services supplied by a company meet or surpass a customer’s expectations. Exclusive Bonus Content: Get our short guide to CES and NPS! How To Measure Customer Satisfaction?
While sometimes it’s okay to follow your instincts, the vast majority of your business-based decisions should be backed by metrics, facts, or figures related to your aims, goals, or initiatives that can ensure a stable backbone to your management reports and business operations. In most cases, this can prove detrimental to the business.
An engineering Key Performance Indicator (KPI) or metric is a clearly defined quantifiable measure that an engineering firm uses to gauge its success over time. With engineering being a very broad field, KPIs are employed in a variety of ways, ranging from company-wide analysis to project specific performance metrics. View Guide Now.
Naveego — A simple, cloud-based platform that allows you to deliver accurate dashboards by taking a bottom-up approach to data quality and exception management. A complete DataOps program will have a unified, system-wide view of process metrics using a common data store. Cognizant – Data and analytics consulting practice.
Data visualizations put together in intuitive dashboards can make the analysis process more dynamic and understandable while keeping the audience engaged. While pie charts have received a bad rep in recent years, we feel that they form a useful visualization tool that serves up important metrics in an easy-to-follow format.
In addition, we will see how online dashboards have overthrown the static nature of classic reports and given way to a much faster, more interactive way of working with data. This insightful report displays relevant metrics such as the top-performing agents, net promoter score, and first contact resolution rate, among others.
Stakeholders have hired consultants or shadow teams to do data work. User feedback may feel concrete to users, but as a data professional, you will have to translate these requirements into metrics. A test coverage dashboard can illustrate progress in quality controls. The data team takes too long to deliver analytics.
That’s why so many rely on accounts receivable dashboards to provide transparency and enable oversight. Accounts receivable dashboards offer a window into everything that matters with A/R. Users can quickly reference key metrics, see updated data in real time, and immediately understand the positives and negatives of performance.
Cloudera has partnered with Rill Data, an expert in metrics at any scale, as Cloudera’s preferred ISV partner to provide technical expertise and support services for Apache Druid customers. Deploying metrics shouldn’t be so hard. Intuitive metrics, simple design. Co-author: Mike Godwin, Head of Marketing, Rill Data.
How many metrics can you call adorable? Site abandonment rate is an adorable metric, to me : ), for these reasons: Money, money, money baby. IMHO there isn't a metric out there that can tell you a lot so quickly and any improvement you make to it will directly and immediately impact the bottom-line. My hypothesis is that.
Companies should therefore already be taking concrete steps to implement the EU AI Act and the EU Data Act, explains Daniel Andernach , Associated Partner at MHP , an international management and IT consultancy. In this context, clear responsibilities lie primarily with IT, legal, compliance and data protection departments.
An extraordinary amount of time, effort, $$$ are spent on building dashboards/scorecards for CMOs… Yet, the end result, nearly always, is a useless data puke. CMO dashboards end up being useless when capabilities exceed needs. Personal Bias: I prefer the word Scorecard over Dashboard. It turns out boiling the ocean is hard.
In today’s business world, competition is fierce across all industries and sectors, which means that to survive and thrive, working with measurable online data analysis and performance metrics is essential. Working with service desk metrics and KPI reports will help you make the improvements you need for continual growth and success.
c) Dashboard Features. Business intelligence tools provide you with interactive BI dashboards that serve as powerful communication tools to keep teams engaged and connected. 3) Dashboards. Here you will find some of the main BI tool features related to dashboard management: a) Built-in dashboard templates.
Business analysts sometimes perform data science, but usually, they integrate and visualize data and create reports and dashboards from data supplied by other groups. They see the data errors , the production errors, the broken reports and the inaccurate dashboards. The work product could be a chart, graph, model or dashboard.
This makes it impossible to identify any correlations, explains Viole Kastrati, Senior Consultant SAP BI & Analytics at Nagarro. Solid reporting provides transparent, consistent and combined HR metrics essential for strategic planning, risk management and the management of HR measures.
Also, limited resources make looking for qualified professionals such as data science experts, IT infrastructure professionals and consulting analysts impractical and worrisome. Check out this investor relations dashboard example below, part of our management dashboard series: **click to enlarge**.
Getting an entry-level position at a consulting firm is also a great idea – the big ones include IBM, Accenture, Deloitte, KPMG, and Ernst and Young. BI consultant. A BI consultant needs to provide expertise in the design, development, and implementation of BI and analytics tools and systems.
Consulting. Second… well there is no second, it is all about the big action and getting a big impact on your bottom-line from your big investment in analytics processes, consulting, people and tools. 5: 80% of your external consulting spend is focused super-hard analysis problems. #4: An Analysis Ninjas' work does.
One of my favorite parts of the annual IBIS event is the Dashboard Awards as every year I love to see the amazing dashboard solutions organizations have created with BI tools. Here are the categories and the winners: The 2021 Best Business Dashboard Award. The 2021 Limitless BI Dashboard Award. Congratulations!
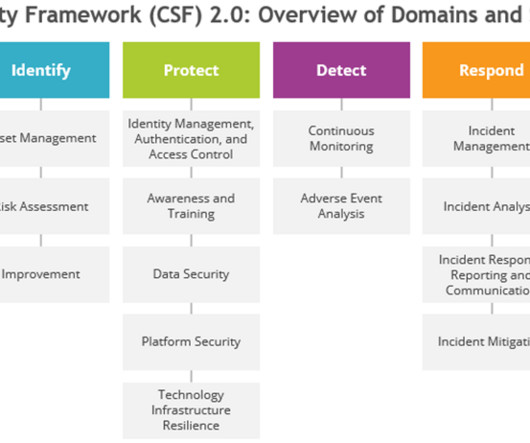
Clearly defined metrics with target thresholds: Using performance metrics allows for an unbiased reading of the performance from a security program process. Metrics should be based on the key objectives of a security process. Ideally, these performance metrics already exist for security processes.
Emission factor mapping and other capabilities As part of Oracle Fusion Cloud Sustainability, enterprises would get access to features such as automated transaction records, contextualized data, pre-built dashboards, emission factor mapping, and audit capabilities.
This is where business intelligence consulting comes into the picture. BI consulting comes as a huge relief for organizations because implementing BI and analytics is a time-consuming, capital and labor intensive process that is essential for every business aiming for high-growth and sustainability. What is Business Intelligence?
This is where business intelligence consulting comes into the picture. BI consulting comes as a huge relief for organizations because implementing BI and analytics is a time-consuming, capital and labor intensive process that is essential for every business aiming for high-growth and sustainability. What is Business Intelligence?
What is management dashboard? Management dashboard is suitable for different business fields and various departments of enterprises. In the form of easy-to-read charts and numbers, management dashboard displays all important business key performance indicators (KPIs) on the corresponding dashboards. Request Demo.
While it’s critical for tech leaders to communicate throughout a digital project, it’s also important to communicate appropriately, says Rich Nanda, US strategy and analytics offerings leader, at Deloitte Consulting. Rich Nanda, US strategy and analytics offerings leader, Deloitte Consulting. Deloitte Consulting. “In
Sales dashboards are an essential tool in this process. This guide provides a comprehensive overview of sales dashboards, including their definition, significance, steps for creating one, and useful tips. Additionally, we will offer various examples of sales dashboards to help you streamline your work effectively.
You can run a direct query from QuickSight for BI reporting and dashboards. You can use Amazon Managed Grafana for near-real-time trade dashboards that are refreshed every few seconds. Historical quotes analysis In this section, we explore some examples of historical quotes analysis from the Amazon QuickSight dashboard.
By 2025, it’s estimated we’ll have 463 million terabytes of data created every day,” says Lisa Thee, data for good sector lead at Launch Consulting Group in Seattle. To gain employee buy-in, Stout’s team builds BI dashboards to show them how they can easily connect to and interact with their data, as well as visualize it in a meaningful way.
A vast majority of occasions where data is presented (reports, executive dashboards, conference presentations, or just plain here's a automated emailed thingy from Google Analytics ) end up being abject failures because most of the discussion is still about the data. This graph is from an article by the consulting company McKinsey.
At the core of everything you will do in digital analytics is the concept of metrics. How do you define a metric: It is simply a number. Your digital analytics tools are full of metrics. Helpful post: Best Metrics For Digital Marketing: Rock Your Own And Rent Strategies.]. Now you have your foundation, metrics and KPIs.
No need to be worried anymore, all these management problems could be settled with digital dashboard. Digital dashboard: definition & benefits. Digital dashboard is one of the forms of applying business intelligence in reality. Workshop application of FineReport’s digital dashboard. Digital dashboard software.
Do you need a series of matching dashboards? Instead, produce a series of matching dashboards through the magic of lookup functions and drop-down menus. Step 0: Get Your Dataset into Excel Let’s pretend we want one dashboard per program. One per program, school, or state? Save time with my automation process.
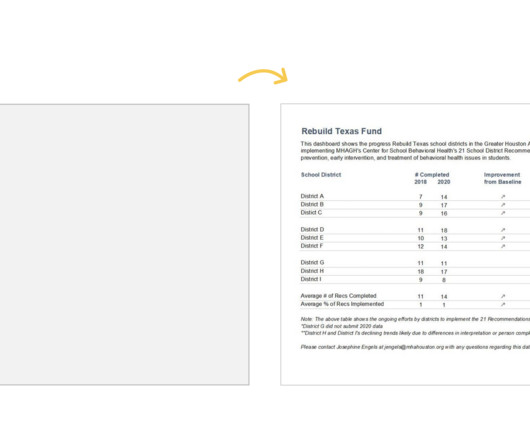
Dashboards aren’t supposed to take forever. They don’t even need to be outsourced to a consultant. Dashboards are supposed to be fast and easy. In this article, you’ll see examples of real dashboards that you can use as inspiration for your own workplace. Adapt one of these dashboards instead.
The marketing field is ahead of the curve, having been a metrics-driven industry for decades, but which metrics a company decides to focus on, how they track and report (and analyze) those metrics, and what they do with that analysis makes all the difference. Explore Dashboard. says Garrett.
As we explore examples of data analysis reports and interactive report data analysis dashboards, we embark on a journey to unravel the nuanced art of transforming raw data into meaningful narratives that empower decision-makers. Try FineReport Now 1.1 Try FineReport Now 1.1
We organize all of the trending information in your field so you don't have to. Join 42,000+ users and stay up to date on the latest articles your peers are reading.
You know about us, now we want to get to know you!
Let's personalize your content
Let's get even more personalized
We recognize your account from another site in our network, please click 'Send Email' below to continue with verifying your account and setting a password.


Let's personalize your content