This site uses cookies to improve your experience. To help us insure we adhere to various privacy regulations, please select your country/region of residence. If you do not select a country, we will assume you are from the United States. Select your Cookie Settings or view our Privacy Policy and Terms of Use.
Cookie Settings
Cookies and similar technologies are used on this website for proper function of the website, for tracking performance analytics and for marketing purposes. We and some of our third-party providers may use cookie data for various purposes. Please review the cookie settings below and choose your preference.
Used for the proper function of the website
Used for monitoring website traffic and interactions
Cookie Settings
Cookies and similar technologies are used on this website for proper function of the website, for tracking performance analytics and for marketing purposes. We and some of our third-party providers may use cookie data for various purposes. Please review the cookie settings below and choose your preference.
Strictly Necessary: Used for the proper function of the website
Performance/Analytics: Used for monitoring website traffic and interactions
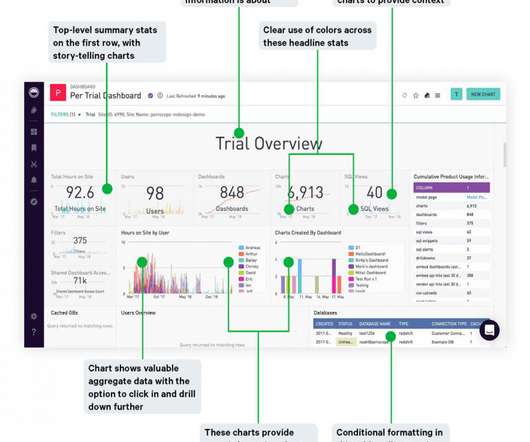
Everyone wants to get more out of their data, but how exactly to do that can leave you scratching your head. A well-constructed and organized dashboard empowers users to make better data-driven decisions. In this very visual post, we’ll discuss the elements that make or break a dashboard and dissect two examples.
How Data Literacy Turns Data from a Burden to a Benefit. Today, data literacy is more important than ever. Data is now being used to support business decisions few executives thought they’d be making even six months ago. So, what is data literacy? What Is Data Literacy? Data Literacy Definition.
Dubbed Cropin Cloud, the suite comes with the ability to ingest and process data, run machine learning models for quick analysis and decision making, and several applications specific to the industry’s needs. The suite, according to the company, consists of three layers: Cropin Apps, the Cropin Data Hub and Cropin Intelligence.
In our world of digital analytics often these things are called dashboards… I had to shrink the size to make it fit the available screen, but even if you saw it at full glorious resolution, I'm sure you'll very quickly come to the conclusion that this is just a data puke. Yes, it does summarize data from many reports into one.
In her current role as VP of UX, Design & Research at Sigma Computing, she deploys human-centric design to support data democratization and analysis. Less than 40 percent of Fortune 1000 companies are managing data as an asset and only 24 percent of executives consider their organization to be data-driven.
With the ability of manufacturers to store a huge volume of historical data, AI can be applied in general business areas of any industry, like developing recommendations for marketing, supply chain optimization, and new product development. With AI, it can even prescribe the appropriate action that needs to be taken and when.
business users can access trusted data natively in an expanded suite of beloved products, as Alation Connected Sheets now works with Microsoft Excel and Alation Anywhere will work with Microsoft Teams. These new updates help teams collaborate more efficiently by connecting the data intelligence of Alation to the productivity tools they love.
What stands out is the company's ability to bring creative thinking and problem-solving approaches to business problems, and layering in data and AI expertise and accelerators to derive solutions” - Reetika Fleming, Research VP, HFS Research. Download Report. Other Awards and Mentions. AI for Enterprises - Thought Leadership.
Our first series “AI for Digital Enterprise” combines the role of AI and data science with various facets of the Digital Transformation journey. BRIDGEi2i was honored with its second Honorable Mention in Gartner’s 2020 Magic Quadrant for Data and Analytics Service Providers, Worldwide. COVID Visualization Dashboards.
The scope of this research includes cross-industry Analytics & Insights Services capabilities, strategy & consulting, Business Intelligence (BI) & visualization, and advanced analytics for decision support.
The emergence of IoT, cloud computing, and big data analytics combined with AI tech has brought enterprises to a tipping point in their journey towards making AI real. BRIDGEi2i Co-Founders, Pritam Kanti Paul and Prithvijit Roy, share anecdotes in a riveting discussion with Samir Sharma on his popular podcast, The Data Strategy Show.
An enterprise data catalog does all that a library inventory system does – namely streamlining data discovery and access across data sources – and a lot more. For example, data catalogs have evolved to deliver governance capabilities like managing data quality and data privacy and compliance.
Collecting and using data to make informed decisions is the new foundation for businesses. The key term here is usable : Anyone can be data rich, and collect vast troves of data. This is where metadata, or the data about data, comes into play. A metadata management framework does the same for your data analysts.
Unlike traditional database systems, a knowledge graph goes beyond the simple storage of data and focuses on the definitions of entities and the connections between them. What makes a knowledge graph a unique and powerful data solution is the semantic (data) model, or ontology , that is part of it.
We organize all of the trending information in your field so you don't have to. Join 42,000+ users and stay up to date on the latest articles your peers are reading.
You know about us, now we want to get to know you!
Let's personalize your content
Let's get even more personalized
We recognize your account from another site in our network, please click 'Send Email' below to continue with verifying your account and setting a password.


Let's personalize your content