This site uses cookies to improve your experience. To help us insure we adhere to various privacy regulations, please select your country/region of residence. If you do not select a country, we will assume you are from the United States. Select your Cookie Settings or view our Privacy Policy and Terms of Use.
Cookie Settings
Cookies and similar technologies are used on this website for proper function of the website, for tracking performance analytics and for marketing purposes. We and some of our third-party providers may use cookie data for various purposes. Please review the cookie settings below and choose your preference.
Used for the proper function of the website
Used for monitoring website traffic and interactions
Cookie Settings
Cookies and similar technologies are used on this website for proper function of the website, for tracking performance analytics and for marketing purposes. We and some of our third-party providers may use cookie data for various purposes. Please review the cookie settings below and choose your preference.
Strictly Necessary: Used for the proper function of the website
Performance/Analytics: Used for monitoring website traffic and interactions
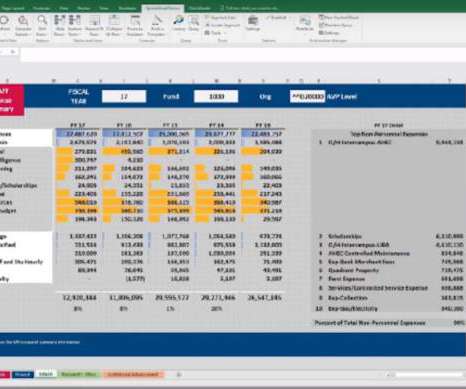
In our information-rich age, a business can accelerate its success by harnessing its organizational data in a way that is both efficient and value-driven. To squeeze every last drop of value from your data, both in an operational and strategic sense, it’s important to leverage the right online reporting tool. Warehousing Costs.
However, if the underlying information isn’t easy to access, analyze or understand, it is pointless. Dashboards often are the best way to gain insight into an organization and its various departments, operations and performance. A dashboard in business is a tool used to manage all the business information from a single point of access.
With this issue in mind, several BI tools have been developed to assist businesses in the generation of interactive reports with just a few clicks, enhancing the way companies make critical decisions and service insights from their most valuable data. How can you push yourself ahead of the pack with the power of information?
Your Chance: Want to build great weekly status reports on your own? Traditional reports are often in a written format, that might include an introduction, body, and conclusion. Even though this weekly report format is needed to summarize some relevant information, it is also static and less efficient.
Data, information, and insights are all around us. Before we even realize our business potentials and want to act in our competitive market, there is always a new business plan to make, a new strategy to develop, a new report to generate – and they all take time. What Is An Automated Report?
Operationalreports have the potential to greatly enhance business performance through the utilization of data-driven insights. These reports offer a structured and comprehensible representation of data, enabling a clearer understanding of complex issues that might otherwise remain elusive. What Is An OperationalReport?
As the use of Hydro grows within REA, it’s crucial to perform capacity planning to meet user demands while maintaining optimal performance and cost-efficiency. Capacity monitoring dashboards As part of our platform management process, we conduct monthly operational reviews to maintain optimal performance.
One of the chief complaints that we hear over and over again from business executives is that they still struggle to get clear, accurate, and timely information out of their business software systems. Stock Reporting Tools Just Aren’t Good Enough. Each of those systems comes with its own dedicated reporting functions.
Of course, regulatory bodies aren’t the only entities with an interest in financial consolidation; this process is also essential to providing stakeholders and investors with better information and disclosures about the state of the organization. The Four Benefits of Automation. Some of the benefits of automation seem obvious.
Therefore, it’s easy to assume that reporting is always going to be difficult, consuming more time than companies would like and creating copious data errors along the way. Rather, these issues are evidence of a financial reporting process that’s producing untrustworthy information and eating extra time along the way.
There are certainly a number of benefits to making the move to cloud ERP. Getting to the cloud, though, will require one more big project, with all of the cost, complexity, and risk that go along with such endeavors. Many software vendors have been shifting to a cloud-first approach to developing, deploying, and selling their software.
Even with the necessary training and experience, Dynamics AX’s Management Reporter is inflexible, inefficient, and difficult to use. Using Management Reporter, every time the accounting team wanted to produce a report, this customer needed to run over 20 different versions of the given report, one version for each entity.
If your business is running Microsoft Dynamics 365 Business Central (D365 BC) , or if you are planning to do so in the near future, then you are probably hearing a lot about Power BI as Microsoft’s preferred reporting and analytics platform for the company’s business applications. How Does Data Access Work with Microsoft D365 BC?
They will automatically get the benefits of CDP Shared Data Experience (SDX) with enterprise-grade security and governance. Cost efficiencies by taking advantage of Spot instances. Figure 1: CDE containerized service for operational management of spark workloads. Also, enterprises can tap into new technologies like Kubernetes.
Perhaps more importantly, it provides an opportunity for the organization to implement measures in advance that can reduce risk, lower costs, and improve the end result. Over the past few years, software vendors moved their applications to the cloud. Successful migration requires considerable time, effort, and advanced planning.
Impala’s planner does not do exhaustive cost-based optimization. Instead, it makes cost-based decisions with more limited scope (for example when comparing join strategies) and applies rule-based and heuristic optimizations for common query patterns. It turns out that Apache Impala scales down with data just as well as it scales up.
The data products used inside the company include insights from user journeys, operationalreports, and marketing campaign results, among others. smava’s Data Platform team faced the challenge to deliver data to stakeholders with different SLAs, while maintaining the flexibility to scale up and down while staying cost-efficient.
In the world of finance and accounting, CFOs are discovering the merits of finance-owned reporting tools. These real-time reporting tools are ideally suited for remote work. At a time when remote work has become the norm, however, many companies are quickly seeing the benefits of embracing new technologies.
Reducing inventory on hand allows for more efficient production planning and operations, and it converts the value of product that is sitting on the shelf to cash in the bank. Inventory reduction has other benefits as well. The cost of holding inventory is often overlooked. It all comes down to the efficiency of working capital.
It also allowed the Client team to measure tactical and operational results at a summary level, and at a detailed level for an individual task, or a group achievement. It supports the Client team in tracking organizational performance, to reduce cost and increase the profitability of each department, without compromising quality.
Whether you work in a hospital, long-term care facility, clinical lab, or a HealthTech company, all workers in the healthcare sector today are focused on value-based care and cost efficiencies. A single investment in embedded analytics reaps a multitude of benefits, both inside and outside the medical facility. Report automation?can
To fulfil these needs, you need direct access to accurate data from your ERP, and the ability to quickly create drillable Excel reports for GL and other finance requirements. To customize an existing report or to create a new one with Crystal Reports, you need technical expertise. But don’t just take our word for it.
A recent survey by insightsoftware and Hanover Research reported 63% of IT decision makers find that finance is either very- or over-reliant on the IT department for operationalreporting. Both statistics are alarming considering market uncertainty increases the demand for more frequent, more accurate forecasts and reporting.
What makes this worse is that in many cases, a reliable, proven, low-cost alternative exists. In other words, what you want is already available off the shelf, and the total cost of ownership is dramatically lower with these tools than with customized solutions. Built-in ERP Reporting Tools. Specialized expertise costs money.
For the accounting department in particular, the ability to collect and collate information, analyze that data, and produce accurate financial and operationalreports quickly has never been more important. All too often, speed comes at a cost. That’s why a quick turnaround on month-end closing is critical.
These tools prep that data for analysis and then provide reporting on it from a central viewpoint. These reports are critical to making decisions. Aggregated views of information may come from a department, function, or entire organization. These benefits provide a 360-degree feedback loop. Who Uses Embedded Analytics?
In fact, a recent Gartner report on cloud expenditure found that cross-industry cloud spend has risen from 8% as a percentage of total IT spend in 2018 to 16% in 2022. There’s no doubt that cloud ERPs have had a profound impact on businesses, transforming the way organizations operate, innovate, and deliver value.
But generating custom reports requires deep technical knowledge and the process is often managed by IT. The process can often take weeks, if not months, and, in many cases, the report or dashboard is limited to a single use case and applicable only to a single business unit or user – often only the requester. Download Now.
The pressures of rising costs, disrupted supply chains, and financial uncertainty require fresh approaches. Lessees face increasing equipment costs that strain budgets and disrupt operations. Lessees benefit from cost stability and operational adaptability, while lessors strengthen client partnerships through tailored support.
Whether from your Oracle ERP Cloud or EBS (on-premises or implemented in a public or private cloud like Oracle Cloud Infrastructure or Azure), you must have the ability to efficiently transform that data into a format that works for your BI tools — for true, enterprise-wide reporting. Does This Challenge Sound Familiar? Access Resource.
As users and stakeholders increasingly rely on your applications reporting, it strengthens your products stickiness and drives demand for additional seats. The key is to focus on the long-term benefits that far outweigh any initial effort. When customers showcase their results, your BI takes center stage, reinforcing its importance.
Countries like China, Japan, Singapore, and Australia each bring their own unique set of rules and disclosure requirements, making it difficult for multi-national enterprises to maintain a consistent financial reporting strategy. Another pain point is the burden of managing cost volatility associated with high-volume imports.
This multi-layered reporting environment places immense stress on finance departments already grappling with the complexity of managing financial data across several jurisdictions. Cross-border operations must reconcile diverse regulatory expectations, making it harder to create a unified, accurate financial narrative.
If the operating theme for finance teams in 2024 was “automate workflows and optimize costs to drive value,” then the operating theme for 2025 is shaping up to be, “stay the course.” Atlas equips your team to unlock seamless reporting in Excel directly from Fabric. Inflation may be receding slowly, but it is receding.
When a company moves from a traditional on premise ERP system to a multi-tenant cloud product such as Microsoft Dynamics 365 Business Central (D365 BC) , there are usually some fundamental changes to the way you generate reports. That has the benefits of being both fast and very straightforward. It’s all yours.
Traditional disclosure methodsoften fragmented and manualare proving inadequate for keeping pace with shifting requirements and time-sensitive reporting cycles. Another key challenge is maintaining consistent, accurate disclosures across internal teams and external stakeholders while operating under shrinking timelines. Privacy Policy.
2025 is forecast to be as impactful as any of the last few years, with continuing advancements in financial and business reporting technology promising to help organizations enhance their operational efficiency and effectiveness. Let’s delve into the biggest financial reporting trends that we expect to define the year.
Implementing a PIM or PXM* solution will bring numerous benefits to your organization, in terms of improving efficiency, increasing sales and conversions, reducing returns, and promoting customer loyalty through more accurate, more complete, and more engaging product content. Here we explore these benefits in more detail.
As compliance requirements become more rigorous, businesses need to be ready for enhanced reporting, detailed recalculations, and deeper risk assessments. This shift challenges traditional tax benefits and heightens scrutiny, signaling the need for companies to evolve their tax strategies. This is the moment to rethink your strategy.
Choosing a transfer pricing method is a top-down strategic decision that benefits from using tools and resources designed to help businesses identify the most advantageous and appropriate methods for their transfer pricing strategy. They are also used in advance of negotiating new advance pricing agreements (APAs).
Successfully migrating your data from one ERP to the next is an essential, but often dreaded, step you must overcome to reap the benefits of a more modern ERP. You don’t want any surprises come reporting time. After the migration, you’ll also be faced with keeping an eye on your new ERP to make sure it’s doing all you need it to do.
Inventory KPIs and metrics are crucial aspects of the reporting process. Inventory KPIs provide businesses with accurate information to make data-driven decisions. Here are some of the benefits of using inventory KPIs for reporting: #1. Reduce costs. Product sales are a vital part of reporting.
It involves projecting the future cash receipts and payments based on historical balance sheet data, current financial information, and anticipated changes in business operations and financing activities. The good news is that downloadable templates and automation software can ease the cash flow forecasting process.
ERP enables real-time visibility and collaboration across the entire supply chain, allowing stakeholders to make informed decisions based on accurate and up-to-date information. Download this brochure for more details about the benefits of connected planning and supply chain management.
We organize all of the trending information in your field so you don't have to. Join 42,000+ users and stay up to date on the latest articles your peers are reading.
You know about us, now we want to get to know you!
Let's personalize your content
Let's get even more personalized
We recognize your account from another site in our network, please click 'Send Email' below to continue with verifying your account and setting a password.


Let's personalize your content