This site uses cookies to improve your experience. To help us insure we adhere to various privacy regulations, please select your country/region of residence. If you do not select a country, we will assume you are from the United States. Select your Cookie Settings or view our Privacy Policy and Terms of Use.
Cookie Settings
Cookies and similar technologies are used on this website for proper function of the website, for tracking performance analytics and for marketing purposes. We and some of our third-party providers may use cookie data for various purposes. Please review the cookie settings below and choose your preference.
Used for the proper function of the website
Used for monitoring website traffic and interactions
Cookie Settings
Cookies and similar technologies are used on this website for proper function of the website, for tracking performance analytics and for marketing purposes. We and some of our third-party providers may use cookie data for various purposes. Please review the cookie settings below and choose your preference.
Strictly Necessary: Used for the proper function of the website
Performance/Analytics: Used for monitoring website traffic and interactions
Analytics technology has shaped many aspects of modern business. According to a report we cited last year, 67% of businesses with revenues exceeding $10,000 a year use data analytics. One of the most important reasons companies are investing in analytics technology is to improve their understanding of their customers.
Table of Contents 1) What Are White Label Reports? 2) Benefits Of White Label Reports 3) Key White Label Reporting Features 4) White Label Dashboards & Report Examples In today’s competitive business environment, building a brand that is trusted, recognizable, and loved by many is not an easy task.
As noted in this report from Forrester®, “four out of five global data and analytics decision makers say that their firms want to become more data-driven and perform more advanced predictive analytics and artificial intelligence projects. AI in CustomerAnalytics: Tapping Your Data for Success. Download Now.
According to Forrester, 74% of businesses say they want to be data-driven, but only 29% report that they’re effectively connecting insights and actions. That’s the whole point of using analytics in the first place — helping people take the right action based on what the data tells them. . You probably feel like you have to say “yes.”
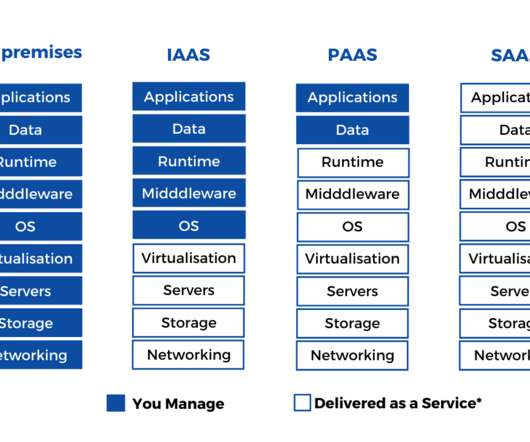
This intermediate layer strikes a balance by refining data enough to be useful for general analytics and reporting while still retaining flexibility for further transformations in the Gold layer. At the same time, the Gold layer’s “single version of the truth” makes data accessible and reliable for reporting and analytics.
Data visualizations are a vital part of embedded analytics. Dig into this report on the future of analytics to understand why! Get the report. Plotly: Open source visualizations for your analytic apps. It is actually a platform that helps you build analytic apps with graphs.
You will have an easier time developing an accurate customer profile with data analytics. billion on customeranalytics, because it has been so effective. The average company that uses customeranalytics has 93% higher profits and 81% higher sales than other companies in their industry.
Business Intelligence is the collection, storage, analysis, and reporting of data to make better business decisions. It can refer to predictive analytics or even “big data.” It will also provide insight into the many different types of reports that you can create with analytics software.
Deal brings operational reporting to insightsoftware’s 25,000+ customers and provides fuel for growth to Logi Analytics’s embedded analytics for commercial software organizations. In 2020, Logi Analytics was again ranked as the best embedded analytics vendor by leading industry researcher Dresner Advisory Service. “As
Automation & Augmented Analytics. Augmented analytics uses artificial intelligence to process data and prepare insights based on them. It allows feeding on more data, simplifying reporting and sharing and eliminating the unnecessary steps to get the feedback. Future of Business Intelligence: Benefits Provided.
These APIs empower developers to tap into any Sisense interface or functionality and enhance, rebrand, or integrate it into the brand’s own analytic apps and off-the-shelf business systems. Customanalytics with the Linux Pivot API. Tomer Lapid is a Product Manager for Sisense analytics and reporting.
Analytics products represent the user-facing and client-facing derived value from an organization’s data stores. Monitoring includes online usage actions, IT system patterns, customer behaviors, environmental (ESG) factors, supply chain, logistics, online trends, social media sentiment, and news reports.
Additionally, cloud technology can also help in improving the condition of a car, where if any maintenance is required, it can be instantly reported and arranged hassle-free. For example, it can automate the QC process to identify defects and do it as quick as possible to avoid faulty products from reaching customers.
Can improved customeranalytics drive actionable insights? What geographies report less advanced capabilities, presenting an advantage? Can social or pervasive technology change the product, extend business reach, or inform adjacencies? What geographies boast digital superiority, presenting opportunities for leverage?
You can use analytics to segment your customers into one-time and repeat customer segments. You can then work on creating more of the type of content that helps you get faithful customers. This helps give insight into the customer’s mindsets and their reason for returning or not returning.
It simplifies the document generation and reporting solutions that enable professionals to understand the data more accurately. Moreover, it offers more accurate insights, which allows you to improve the productivity and performance of your sales team. #7
In the first of two blog posts, we delve into customeranalytics to examine where data makes a difference in delivering an exceptional customer experience. . Customer 360 is essential to connecting with customers.
Production report development (Preparing reports that will be used by others to lookup data that’s needed to do their jobs). Presentation preparation (Preparing displays of data that will be presented in meetings or in customreports).
Topics covered included the opportunities presented by AWS’ new “Lake House” architecture, the benefits of pairing the right cloud solution with the right customanalytics platform, and how actionable intelligence from cloud sources can take a company’s embedded analytics to exciting new places. Get analyst report.
Tools of the Trade is your destination for data and analytics skill building: From dashboards and reports to embedding analytics and building customanalytic apps to SQL secrets and data deep-dives, whatever you need to know to be better at your job, you can find it here.
The casino industry itself is touted to hit the 130 billion yield mark in 2019 according to reports.1 And for to achieve that it’s important to know the customers – a task that can be easily resolved with the help of consumer behaviour analysis. 1 Needless to say, it’s a hugely successful category of business.
Imagination is an underrated part of making analytics in your product really meaningful for users. A recent survey by the Eckerson Group found that, “Independent software vendors report that embedded analytics increases the value of their applications by 43% and enables them to charge 25% more on average.”
However, of that same audience, a paltry 16% reported that data access was widespread throughout their organization. To make matters worse, 61% of respondents said that the lack of sufficiently skilled workers stands in the way of their analytics goals. What we’ve just described only gives users something they know they need.
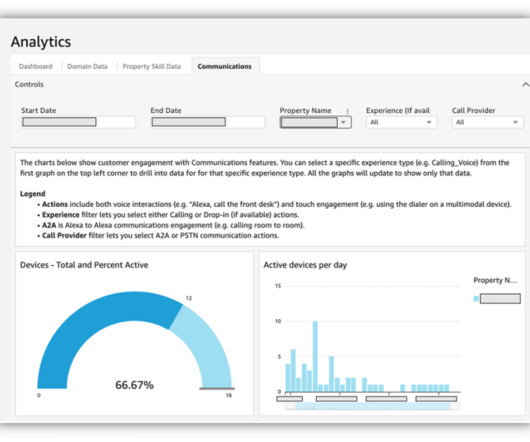
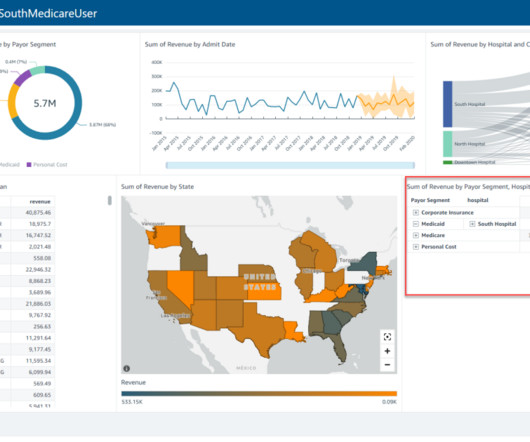
Our customers love the look of the visuals and how easy it is to share them with their customers. Analytics drive engagement With QuickSight, we can now show detailed device usage information, including quantity and frequency, with insights that connect the dots between that engagement and cost savings.
This category is open to organizations that have tackled transformative business use cases by connecting multiple parts of the data lifecycle to enrich, report, serve, and predict. . Industry Transformation: Telkomsel — Ingesting 25TB of data daily to provide advanced customeranalytics in real-time . DATA FOR GOOD.
According to McKinsey, harnessing data through broad and intensive customeranalytics allows organisations to outperform their competitors. View the report: Making Hybrid IT Agile: Using Colocation and Networking to Drive Digital Transformation. Achieving data traction.
Embedded BI platforms deliver real-time reporting and advanced analytics within users’ workflow context, enabling all users to make informed decisions regardless of their analytic skills. Industries benefit significantly from embedded analytics, driving operational efficiency and deeper customer understanding.
Raleigh, N.C – August 4, 2022 – insightsoftware , a global provider of reporting, analytics, and performance management solutions, today announced the release of Logi Composer 7. Notably, the company has been named a winner in the Dresner Industry Excellence Awards for Customer Experience and Vendor Credibility.
Tools of the Trade is your destination for data and analytics skill building: From dashboards and reports to embedding analytics and building customanalytic apps to SQL secrets and data deep-dives, whatever you need to know to be better at your job, you can find it here.
We asked two of our CS leaders about the key data challenges they face and the obstacles CS teams typically encounter that can be overcome by analytics. Read on to see how infused analytics boosts the effectiveness of CS teams and contributes to business growth. CS and analytics now: Challenges. Discover why.
increase in customer lifetime value, 25.3% Without C360, businesses face missed opportunities, inaccurate reports, and disjointed customer experiences, leading to customer churn. Pillar 3: Analytics The analytics pillar defines capabilities that help you generate insights on top of your customer data.
We’re moving away from the one-size-fits-all approach of traditional dashboards to more dynamic, customizedanalytics experiences. Read the report The post A new era in BI: Overcoming low adoption to make smart decisions accessible for all appeared first on IBM Blog.
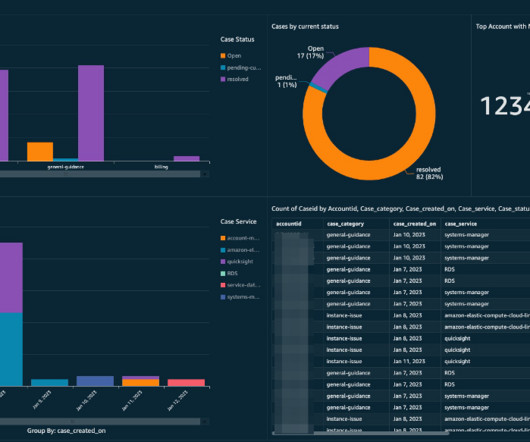
QuickSight meets varying analytic needs from the same source of truth through modern interactive dashboards, paginated reports, embedded analytics, and natural language queries. Select the sheet type that you want ( Interactive sheet or Paginated report ). Select SPICE to change your query mode. Choose Add.
By conducting extensive research and analysis, they generate reports that inform strategic decisions, identify areas for enhancement, and guide the implementation of new initiatives. Data analysts leverage four key types of analytics in their work: Prescriptive analytics: Advising on optimal actions in specific scenarios.
updated / new tables) and the resulting changes to Data Feeds require additional development effort and manual reporting to enterprise data catalogs. For example, CDF has been used to implement enterprise-grade applications such as ingestion and processing of IoT data for customeranalytics, real-time cybersecurity analytics, etc.
This serves as a single point of reference for analytics, reporting and data-based decisions, resulting in increased accuracy and quicker generation of valuable insights. Design considerations: To optimize query frequency for your predictive analysis and reporting, need to carefully design how it accesses data.
Tools of the Trade is your destination for data and analytics skill building: From dashboards and reports to embedding analytics and building customanalytic apps to SQL secrets and data deep-dives, whatever you need to know to be better at your job, you can find it here.
Gartner’s recently released report “Master Data Management Forms the Basis of a Trusted 360-Degree View of the Customer,” shares the results of an executive survey highlighting several key points, including that customer initiatives, are among CEOs’ top five priorities in 2018. You can download the free report here.
Performance tracking and reporting along with pipeline, opportunity, and customeranalytics help sales teams become more effective in meeting growth targets and company objectives. Sales increases forecasting frequency and accuracy while reducing the burden of planning, budgeting, and reporting.
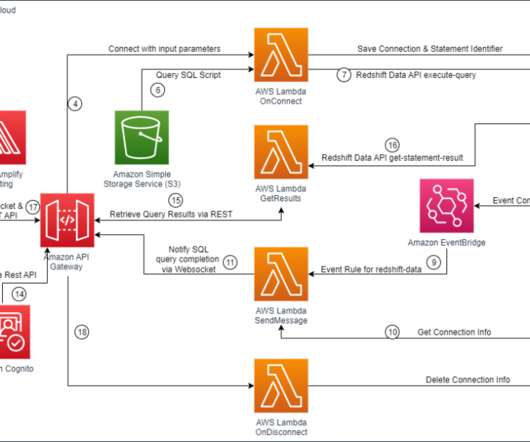
Business teams can gain meaningful insights by simplifying their reporting through web applications and distributing it to a broader audience. Reporting and analysis – An application where you can trigger large analytical queries with dynamic inputs and then view or download the results.
Conclusion The combination of embedding dashboards for users not provisioned in QuickSight and row-level security using tags with OR of AND enables developers and ISVs to quickly set up sophisticated, customizedanalytics for their application users—all without any infrastructure setup or user management, while scaling to millions of users.
A recent study from identity-management company Okta reported that in 2020, the average company had 88 apps in use across the organization; some companies had almost 200! If the right software program or a top-down culture of adopting analytics was enough to get everyone in every industry using analytics, it would have done so by now.
Reasons may vary from business to business but integration is the cornerstone for customer success. With cloud data integration, it gets easier to make reports across departments and data storage will never be an issue. The importance of customeranalytics cannot be overstated in today’s world.
For businesses looking to improve CX, data is a precious commodity: It has the potential to tell them much about their customers’ digital journeys, enabling them to address issues and adopt the intelligent product discovery and recommendations that will deliver more personalized service.
We organize all of the trending information in your field so you don't have to. Join 42,000+ users and stay up to date on the latest articles your peers are reading.
You know about us, now we want to get to know you!
Let's personalize your content
Let's get even more personalized
We recognize your account from another site in our network, please click 'Send Email' below to continue with verifying your account and setting a password.


Let's personalize your content