This site uses cookies to improve your experience. To help us insure we adhere to various privacy regulations, please select your country/region of residence. If you do not select a country, we will assume you are from the United States. Select your Cookie Settings or view our Privacy Policy and Terms of Use.
Cookie Settings
Cookies and similar technologies are used on this website for proper function of the website, for tracking performance analytics and for marketing purposes. We and some of our third-party providers may use cookie data for various purposes. Please review the cookie settings below and choose your preference.
Used for the proper function of the website
Used for monitoring website traffic and interactions
Cookie Settings
Cookies and similar technologies are used on this website for proper function of the website, for tracking performance analytics and for marketing purposes. We and some of our third-party providers may use cookie data for various purposes. Please review the cookie settings below and choose your preference.
Strictly Necessary: Used for the proper function of the website
Performance/Analytics: Used for monitoring website traffic and interactions
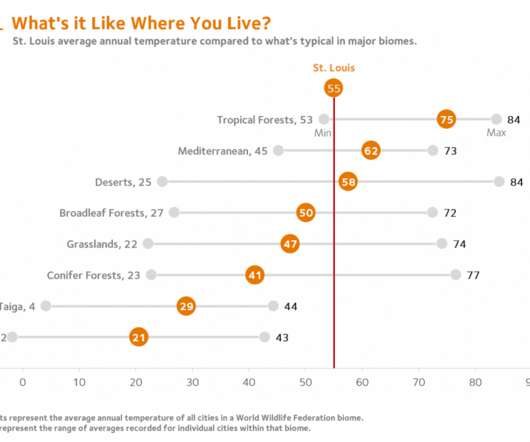
He’s also a Depict Data Studio student and when he shared his work in our graduation ceremony, I knew it needed to be showcased. For the past few months, I’ve been developing dashboards to support students’ understanding of local ecology and equip them to use that local understanding as a baseline to explore the rest of the world.
What a year. Want to do some year-end learning as 2021 winds down? Here are our favorite 21 data visualization resources from the past year. Knowing your audience” is terrible data visualization advice. This year I had the honor of speaking with Bill Jelen, a.k.a. Top 21 Dataviz Resources of 2021.
Wondering what I’ve got planned this year? Online Courses The biggest improvement for 2024 is that all 6 courses will be offered LIVE (!!!). We’ll have 10 minute breaks every hour , and the last 30 minutes is reserved for extra Q&A time. With live classes, you’ll simply show up, learn, and implement.
Table of Contents 1) The Benefits Of Data Visualization 2) Our Top 27 Best Data Visualizations 3) Interactive Data Visualization: What’s In It For Me? 4) Static vs. Animated Data Visualization Data is the new oil? No, data is the new soil.” ” – David McCandless Humans are visual creatures.
The saying “knowledge is power” has never been more relevant, thanks to the widespread commercial use of big data and data analytics. The rate at which data is generated has increased exponentially in recent years. trillion each year. trillion each year. Essential Big Data And Data Analytics Insights.
We organize all of the trending information in your field so you don't have to. Join 42,000+ users and stay up to date on the latest articles your peers are reading.
You know about us, now we want to get to know you!
Let's personalize your content
Let's get even more personalized
We recognize your account from another site in our network, please click 'Send Email' below to continue with verifying your account and setting a password.


Let's personalize your content