This site uses cookies to improve your experience. To help us insure we adhere to various privacy regulations, please select your country/region of residence. If you do not select a country, we will assume you are from the United States. Select your Cookie Settings or view our Privacy Policy and Terms of Use.
Cookie Settings
Cookies and similar technologies are used on this website for proper function of the website, for tracking performance analytics and for marketing purposes. We and some of our third-party providers may use cookie data for various purposes. Please review the cookie settings below and choose your preference.
Used for the proper function of the website
Used for monitoring website traffic and interactions
Cookie Settings
Cookies and similar technologies are used on this website for proper function of the website, for tracking performance analytics and for marketing purposes. We and some of our third-party providers may use cookie data for various purposes. Please review the cookie settings below and choose your preference.
Strictly Necessary: Used for the proper function of the website
Performance/Analytics: Used for monitoring website traffic and interactions
Data landscape in EUROGATE and current challenges faced in datagovernance The EUROGATE Group is a conglomerate of container terminals and service providers, providing container handling, intermodal transports, maintenance and repair, and seaworthy packaging services. Eliminate centralized bottlenecks and complex data pipelines.
Domo is best known as a business intelligence (BI) and analytics software provider, thanks to its functionality for visualization, reporting, data science and embedded analytics.
Customers across diverse industries rely on Amazon OpenSearch Service for interactive log analytics, real-time application monitoring, website search, vector database, deriving meaningful insights from data, and visualizing these insights using OpenSearch Dashboards.
Data and big dataanalytics are the lifeblood of any successful business. Getting the technology right can be challenging but building the right team with the right skills to undertake data initiatives can be even harder — a challenge reflected in the rising demand for big data and analytics skills and certifications.
We have also included vendors for the specific use cases of ModelOps, MLOps, DataGovOps and DataSecOps which apply DataOps principles to machine learning, AI, datagovernance, and data security operations. . ICEDQ — Software used to automate the testing of ETL/Data Warehouse and Data Migration.
For example, one of our customers, Bristol Myers Squibb (BMS), leverages Amazon DataZone to address their specific datagovernance needs. This feature also supports metadata enforcement for subscription requests of a data product. For instructions on how to set this up, refer to Amazon DataZone data products.
This is one of the most important dataanalytics techniques as it will shape the very foundations of your success. To help you ask the right things and ensure your data works for you, you have to ask the right data analysis questions. Harvest your data. Build a data management roadmap. Answer your questions.
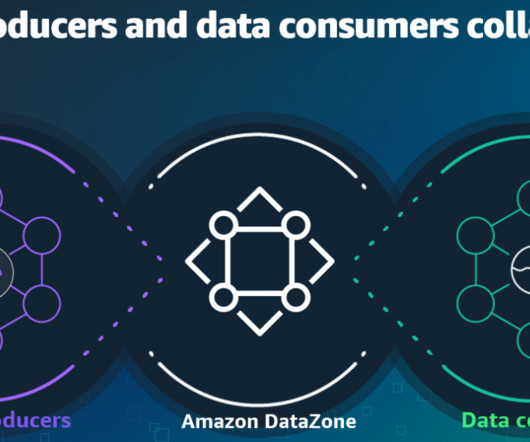
In August, we wrote about how in a future where distributed data architectures are inevitable, unifying and managing operational and business metadata is critical to successfully maximizing the value of data, analytics, and AI.
The data teams share a common objective; to create analytics for the (internal or external) customer. Execution of this mission requires the contribution of several groups: data center/IT, data engineering, data science, data visualization, and datagovernance.
Without real-time insight into their data, businesses remain reactive, miss strategic growth opportunities, lose their competitive edge, fail to take advantage of cost savings options, don’t ensure customer satisfaction… the list goes on. For this purpose, you can think about a datagovernance strategy. click to enlarge**.
How do businesses transform raw data into competitive insights? Dataanalytics. Modern businesses are increasingly leveraging analytics for a range of use cases. Analytics can help a business improve customer relationships, optimize advertising campaigns, develop new products, and much more. What is DataAnalytics?
Improved datagovernance: Vertical SaaS is positioned to address datagovernance procedures via the inclusion of industry-specific compliance capabilities, which has the additional benefit of providing increased transparency. 9) A Mobile-First Mindset.
The DataOps Manifesto is a useful set of principles to guide your understanding of these powerful, grounded, industry-spanning ideas on improving technical team productivity, delivery quality, and cycle time in dataanalytics. So today, another fundamental idea needs to be defined and given the manifesto treatment: the Data Journey.
In today’s data-driven landscape, businesses are leaning more on BI tools , particularly BI dashboard solutions, to enhance decision-making through data visualization. These BI Dashboard tools blend advanced analytics with user-friendly interfaces, revealing invaluable insights.
But in the future, you can overcome this challenge and benefit from having insights from data if you set up an effective management dashboard for your goals.xc2xa0 A dashboard is a visual information management tool that enables you to track relevant data points and key performance indicators (KPIs) at a glance.
The solution uses AWS services such as AWS HealthLake , Amazon Redshift , Amazon Kinesis Data Streams , and AWS Lake Formation to build a 360 view of patients. With zero-ETL features for data integration on AWS, it is effortless to build a view of patients securely, cost-effectively, and with minimal effort.
Why is dataanalytics important for travel organizations? With dataanalytics , travel organizations can gain real-time insights about customers to make strategic decisions and improve their travel experience. What are common data challenges for the travel industry? Travel can be stressful and emotionally fraught.
To achieve data-driven management, we built OneData, a data utilization platform used in the four global AWS Regions, which started operation in April 2022. The platform consists of approximately 370 dashboards, 360 tables registered in the data catalog, and 40 linked systems. Promote and expand the use of databases.
Data can be used to solve many problems faced by governments, and in times of crisis, can even save lives. . In Australia, the Government of New South Wales (NSW) is using dataanalytics to understand the impact of COVID-19, and also to make informed decisions driven by the data collected from across the state.
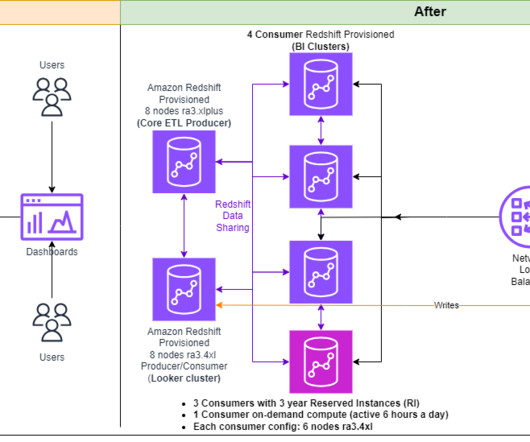
Sun King is driven by data for analyzing areas of growth across thousands of miles using a dashboards that are powered by Amazon Redshift. In this post, we share how Sun King uses Amazon Redshift and Redshift’s features like Data Sharing capabilities to improve the performance of queries in Looker for over 1,000 of our staff.
Several hospitals have also employed data intelligence tools in their services and operational processes. These hospitals are making use of dashboards that provide summary information on hospital patient trends, treatment costs, and waiting times. Apply real-time data in marketing strategies. Expanding big data.
The application supports custom workflows to allow demand and supply planning teams to collaborate, plan, source, and fulfill customer orders, then track fulfillment metrics via persona-based operational and management reports and dashboards. Amazon Aurora PostgreSQL is used to maintain the configuration values for populating the UI.
Target – Dashboards to be refreshed on a daily basis that would provide insights on sales, gross profit, sales pipelines, and customers. Data quality for account and customer data – Altron wanted to enable data quality and datagovernance best practices. BI users create dashboards and reports in QuickSight.
Amazon Redshift is a fully managed cloud data warehouse that’s used by tens of thousands of customers for price-performance, scale, and advanced dataanalytics. Getir’s dataanalytics environment encompasses hundreds of terabytes of data, thousands of tables, and billions upon billions of data rows.
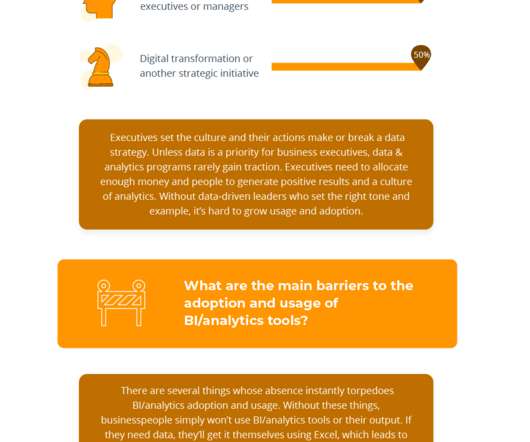
Understanding the low adoption rate The low adoption rate of traditional BI tools, particularly dashboards, is a multifaceted issue rooted in both the inherent limitations of these tools and the evolving needs of modern businesses. Dashboards are static and require users to come with specific queries or metrics in mind.
The outline of the call went as follows: I was taking to a central state agency who was organizing a datagovernance initiative (in their words) across three other state agencies. All four agencies had reported an independent but identical experience with datagovernance in the past. Information (processed data).
One potential solution to this challenge is to deploy self-service analytics, a type of business intelligence (BI) that enables business users to perform queries and generate reports on their own with little or no help from IT or data specialists. But there are right and wrong ways to deploy and use self-service analytics.
In this post, we discuss how you can use purpose-built AWS services to create an end-to-end data strategy for C360 to unify and govern customer data that address these challenges. The following diagram shows a sample C360 dashboard built on Amazon QuickSight.
After a hiatus of a few months, the latest version of the peterjamesthomas.com Data and Analytics Dictionary is now available. It includes 30 new definitions, some of which have been contributed by people like Tenny Thomas Soman, George Firican, Scott Taylor and and Taru Väre. Thanks to all of these for their help.
Collaboration – Analysts, data scientists, and data engineers often own different steps within the end-to-end analytics journey but do not have an simple way to collaborate on the same governeddata, using the tools of their choice. This is more than mere data; it’s our dynamic journey.”
Tracking such user queries as part of the centralized governance of the data warehouse helps stakeholders understand potential risks and take prompt action to mitigate them following the operational excellence pillar of the AWS DataAnalytics Lens. Create a governancedashboard with the appropriate visualization type.
In this post, we walk you through the top analytics announcements from re:Invent 2024 and explore how these innovations can help you unlock the full potential of your data. Readers can create up to five schedules per dashboard for themselves.
We’ve even gone as far as saying that every company is a data company , whether they know it or not. And every business – regardless of the industry, product, or service – should have a dataanalytics tool driving their business. Some organizations empower its end users with interactive dashboards. Go Big, go data.
The data becomes available in Amazon Redshift within seconds, allowing users to use the analytics features of Amazon Redshift and capabilities like data sharing, workload optimization autonomics, concurrency scaling, machine learning, and many more. Choose Query data to open Query Editor v2. sample analytic queries.
In this post, we discuss how the Amazon Finance Automation team used AWS Lake Formation and the AWS Glue Data Catalog to build a data mesh architecture that simplified datagovernance at scale and provided seamless data access for analytics, AI, and machine learning (ML) use cases. Rajesh Rao is a Sr.
Our rigorous datagovernance framework ensures the foundation of our analyses is rock-solid.” Prioritizing data that business users can act on is also vital. Visualizations, such as charts, graphs, and dashboards, are instrumental in conveying complex data in an understandable format.
Usage growth is primarily fueled by “off-license” usage from front-line workers using BI/analytics output embedded in operational applications as well as external users (e.g., customers and suppliers) using external-facing reports and dashboards. On the other hand, BI/analytics usage is bolstered by: data-driven executives.
Governance. Risk Management (most likely within context of governance). Note: Delivery of data, analytics solutions and the sustainment of technology, data and services is a question. What are the new trends around the Data solution architecture (centralized vs de-centralized?). Product Management.
Talend’s data management environment running on Cloudera Data Platform enables you to create and execute Hadoop and Spark integration jobs, process and reconcile Big Data, and implement datagovernance processes using an intuitive drag-and-drop interface. Certified Application Monitoring Tools Partners.
Due to the convergence of events in the dataanalytics and AI landscape, many organizations are at an inflection point. IBM Cloud Pak for Data Express solutions provide new clients with affordable and high impact capabilities to expeditiously explore and validate the path to become a data-driven enterprise.
The data lakehouse architecture combines the flexibility, scalability and cost advantages of data lakes with the performance, functionality and usability of data warehouses to deliver optimal price-performance for a variety of data, analytics and AI workloads.
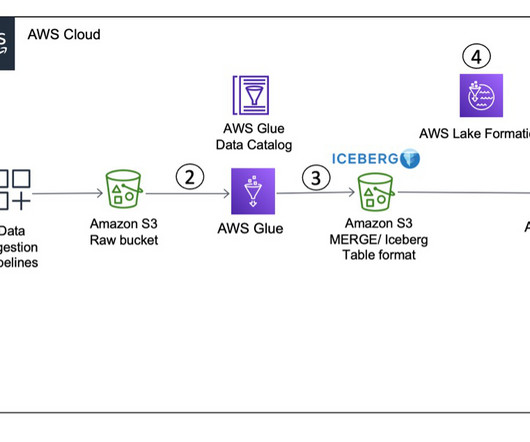
Building a data lake on Amazon Simple Storage Service (Amazon S3) provides numerous benefits for an organization. You get the flexibility to choose the table and file format best suited for your use case and get the benefit of centralized datagovernance to secure data access when using Athena.
This report is essential for understanding revenue streams, identifying opportunities for optimization, and making data-driven decisions regarding pricing and promotions. In summary, the native Snowflake connector and private connectivity model outlined here provide a performant, secure way to include Snowflake data in AWS big data workflows.
Wang also says Peloton is considering supporting specific personas for those who need analytics around financial information governed by securities regulations, and another for users who need to perform analytics on datagoverned by regulations around personally identifiable information (PII).
We organize all of the trending information in your field so you don't have to. Join 42,000+ users and stay up to date on the latest articles your peers are reading.
You know about us, now we want to get to know you!
Let's personalize your content
Let's get even more personalized
We recognize your account from another site in our network, please click 'Send Email' below to continue with verifying your account and setting a password.


Let's personalize your content