This site uses cookies to improve your experience. To help us insure we adhere to various privacy regulations, please select your country/region of residence. If you do not select a country, we will assume you are from the United States. Select your Cookie Settings or view our Privacy Policy and Terms of Use.
Cookie Settings
Cookies and similar technologies are used on this website for proper function of the website, for tracking performance analytics and for marketing purposes. We and some of our third-party providers may use cookie data for various purposes. Please review the cookie settings below and choose your preference.
Used for the proper function of the website
Used for monitoring website traffic and interactions
Cookie Settings
Cookies and similar technologies are used on this website for proper function of the website, for tracking performance analytics and for marketing purposes. We and some of our third-party providers may use cookie data for various purposes. Please review the cookie settings below and choose your preference.
Strictly Necessary: Used for the proper function of the website
Performance/Analytics: Used for monitoring website traffic and interactions
Need for a data mesh architecture Because entities in the EUROGATE group generate vast amounts of data from various sourcesacross departments, locations, and technologiesthe traditional centralized dataarchitecture struggles to keep up with the demands for real-time insights, agility, and scalability.
In August, we wrote about how in a future where distributed dataarchitectures are inevitable, unifying and managing operational and business metadata is critical to successfully maximizing the value of data, analytics, and AI.
This post describes how HPE Aruba automated their Supply Chain management pipeline, and re-architected and deployed their data solution by adopting a modern dataarchitecture on AWS. Each file arrives as a pair with a tail metadata file in CSV format containing the size and name of the file.
To improve the way they model and manage risk, institutions must modernize their data management and data governance practices. Implementing a modern dataarchitecture makes it possible for financial institutions to break down legacy data silos, simplifying data management, governance, and integration — and driving down costs.
First, you must understand the existing challenges of the data team, including the dataarchitecture and end-to-end toolchain. She applies some calculations and forwards the file to a data engineer who loads the data into a database and runs a Talend job that performs ETL to dimensionalize the data and produce a Data Mart.
Amazon SageMaker Lakehouse provides an open dataarchitecture that reduces data silos and unifies data across Amazon Simple Storage Service (Amazon S3) data lakes, Redshift data warehouses, and third-party and federated data sources. connection testing, metadata retrieval, and data preview.
We will partition and format the server access logs with Amazon Web Services (AWS) Glue , a serverless data integration service, to generate a catalog for access logs and create dashboards for insights. These logs can track activity, such as data access patterns, lifecycle and management activity, and security events.
The CLEA dashboards were built on the foundation of the Well-Architected Lab. For more information on this foundation, refer to A Detailed Overview of the Cost Intelligence Dashboard. Data providers and consumers are the two fundamental users of a CDH dataset. These ingested datasets are used as a source in CLEA dashboards.
Over the years, data lakes on Amazon Simple Storage Service (Amazon S3) have become the default repository for enterprise data and are a common choice for a large set of users who query data for a variety of analytics and machine leaning use cases. Analytics use cases on data lakes are always evolving.
But what data things are interconnected? Most of the time we think about data fields & files, columns & tables, reports & dashboards. The complex challenge here is to have the lineage be intelligently updated as the data landscape and processing dynamically bubbles and changes daily across an enterprise.
Companies can now capitalize on the value in all their data, by delivering a hybrid data platform for modern dataarchitectures with data anywhere. Cloudera Data Platform (CDP) is designed to address the critical requirements for modern dataarchitectures today and tomorrow.
At the same time, they need to optimize operational costs to unlock the value of this data for timely insights and do so with a consistent performance. With this massive data growth, data proliferation across your data stores, data warehouse, and data lakes can become equally challenging.
The company is expanding its partnership with Collibra to integrate Collibra’s AI Governance platform with SAP data assets to facilitate data governance for non-SAP data assets in customer environments. “We We are also seeing customers bringing in other data assets from other apps or data sources.
SAP helps to solve this search problem by offering ways to simplify business data with a solid data foundation that powers SAP Datasphere. It fits neatly with the renewed interest in dataarchitecture, particularly data fabric architecture. They fail to get a grip on their data.
Companies can now capitalize on the value in all their data, by delivering a hybrid data platform for modern dataarchitectures with data anywhere. Cloudera Data Platform (CDP) is designed to address the critical requirements for modern dataarchitectures today and tomorrow.
With Cloudera’s vision of hybrid data , enterprises adopting an open data lakehouse can easily get application interoperability and portability to and from on premises environments and any public cloud without worrying about data scaling. Why integrate Apache Iceberg with Cloudera Data Platform?
In this post, we will review the common architectural patterns of two use cases: Time Series Data Analysis and Event Driven Microservices. All these architecture patterns are integrated with Amazon Kinesis Data Streams. Refer to Amazon Kinesis Data Streams integrations for additional details.
Profile aggregation – When you’ve uniquely identified a customer, you can build applications in Managed Service for Apache Flink to consolidate all their metadata, from name to interaction history. Then, you transform this data into a concise format. The following diagram shows a sample C360 dashboard built on Amazon QuickSight.
Having an accurate and up-to-date inventory of all technical assets helps an organization ensure it can keep track of all its resources with metadata information such as their assigned oners, last updated date, used by whom, how frequently and more. This is a guest blog post co-written with Corey Johnson from Huron.
Generative SQL uses AI to analyze user intent, query patterns, and schema metadata to identify common SQL query patterns directly allowing you to get insights faster in a conversational format without extensive knowledge of your organization’s complex database metadata.
The RDV organizes data into three key types of tables: Hubs – This type of table represents a core business entity such as a customer. Each record in a hub table is married with metadata that identifies the record’s creation time, originating source system, and unique business key.
You can set up a single-view dashboard in CloudWatch to visualize application-level and job-level metrics using an AWS CloudFormation template provided on the EMR Serverless CloudWatch Dashboard GitHub repository. Choose the dashboard to see the different metrics for the EMR Serverless application in a single dashboard view.
From 2000 to 2015, I had some success [5] with designing and implementing Data Warehouse architectures much like the following: As a lot of my work then was in Insurance or related fields, the Analytical Repositories tended to be Actuarial Databases and / or Exposure Management Databases, developed in collaboration with such teams.
We foresee organizations pivoting focus beyond the algorithm to things like business-ready predictive dashboards, visualizations, and applications that simplify the use of AI systems to reach conclusions. These features provide businesses with a common metadata, security, and governance model across all their data.
Geocoding Geocoding is the process of adding location metadata to an organization’s datasets. By tagging data with geographical coordinates to track where it originated from, where it has been and where it resides, an organization can ensure national and global geographic data standards are being met.
While the essence of success in data governance is people and not technology, having the right tools at your fingertips is crucial. Technology is an enabler, and for data governance this is essentially having an excellent metadata management tool. Next to data governance, dataarchitecture is really embedded in our DNA.
Streaming jobs constantly ingest new data to synchronize across systems and can perform enrichment, transformations, joins, and aggregations across windows of time more efficiently. OpenSearch Service offers visualization capabilities powered by OpenSearch Dashboards and Kibana (1.5
We wanted to introduce a Kappa architecture to serve not only our operational data needs, but our analytical data needs too. And we wanted to do this through one dataarchitecture where possible, so that we didn’t duplicate processes. We made data available to those that needed it and the experts that are there.
IBM Cloud Pak for Data Express solutions offer clients a simple on ramp to start realizing the business value of a modern architecture. Data governance. The data governance capability of a data fabric focuses on the collection, management and automation of an organization’s data.
dashboards), it can leave your consumers frustrated with their experience. Modeling Your Data for Performance. Dataarchitecture. The data landscape has changed significantly over the last two decades. Redshift sort keys allow you to specify in what order the data is stored across your nodes.
There are many tactics to employ that might help – including data literacy; storytelling; use of our value pyramid/business value model; use of our decision intelligence model. Link to item 6 on slide 27 is broken, [link] , for Dashboard to measure business impact, can you provide a current link? That is the key.
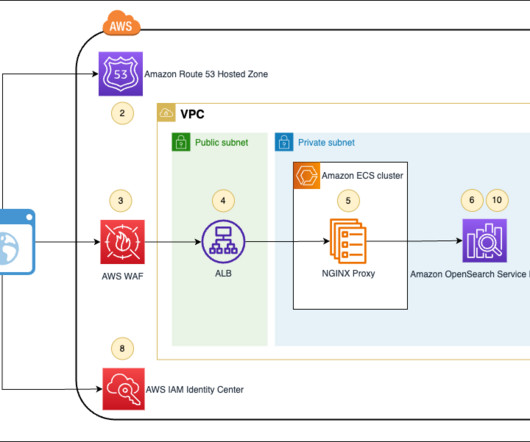
Refer to How can I access OpenSearch Dashboards from outside of a VPC using Amazon Cognito authentication for a detailed evaluation of the available options and the corresponding pros and cons. The workflow consists of the following steps: The user navigates to the OpenSearch Dashboards URL in their browser.
These inputs reinforced the need of a unified data strategy across the FinOps teams. We decided to build a scalable data management product that is based on the best practices of modern dataarchitecture. Our source system and domain teams were mapped as data producers, and they would have ownership of the datasets.
Amazon Redshift powers data-driven decisions for tens of thousands of customers every day with a fully managed, AI-powered cloud data warehouse, delivering the best price-performance for your analytics workloads.
When effectively implemented, a data democracy simplifies the data stack, eliminates data gatekeepers, and makes the company’s comprehensive data platform easily accessible by different teams via a user-friendly dashboard. Then, it applies these insights to automate and orchestrate the data lifecycle.
ML helps users prepare data to enhance reports and to select appropriate data visualizations in visual analysis and dashboards. Architectures and modern tools which enable business users to search, prepare and analyze data will pave the way to reacting promptly to market changes.
Their dashboards were visually stunning. In turn, end users were thrilled with the bells and whistles of charts, graphs, and dashboards. As rich, data-driven user experiences are increasingly intertwined with our daily lives, end users are demanding new standards for how they interact with their business data.
We organize all of the trending information in your field so you don't have to. Join 42,000+ users and stay up to date on the latest articles your peers are reading.
You know about us, now we want to get to know you!
Let's personalize your content
Let's get even more personalized
We recognize your account from another site in our network, please click 'Send Email' below to continue with verifying your account and setting a password.


Let's personalize your content