This site uses cookies to improve your experience. To help us insure we adhere to various privacy regulations, please select your country/region of residence. If you do not select a country, we will assume you are from the United States. Select your Cookie Settings or view our Privacy Policy and Terms of Use.
Cookie Settings
Cookies and similar technologies are used on this website for proper function of the website, for tracking performance analytics and for marketing purposes. We and some of our third-party providers may use cookie data for various purposes. Please review the cookie settings below and choose your preference.
Used for the proper function of the website
Used for monitoring website traffic and interactions
Cookie Settings
Cookies and similar technologies are used on this website for proper function of the website, for tracking performance analytics and for marketing purposes. We and some of our third-party providers may use cookie data for various purposes. Please review the cookie settings below and choose your preference.
Strictly Necessary: Used for the proper function of the website
Performance/Analytics: Used for monitoring website traffic and interactions
Soon businesses of all sizes will have so much amount of information that dashboardsoftware will be the most invaluable resource a company can have. Visualizing the data and interacting on a single screen is no longer a luxury but a business necessity. That’s why we welcome you to the world of interactive dashboards.
Generative artificial intelligence ( genAI ) and in particular large language models ( LLMs ) are changing the way companies develop and deliver software. The future will be characterized by more in-depth AI capabilities that are seamlessly woven into software products without being apparent to end users. An overview.
We won’t delve into details about the career prospects of this C-level position but we will present COO dashboards and reports that are critical for helping chief operating officers across the world to effectively manage their time, company, operational processes, and results. How to create a COO dashboard? What is a COO report?
To successfully gain control and improve a company’s technological needs, CTO dashboards and reports are needed as invaluable tools that consolidate multiple data points and support chief officers in strategic developments as well as online data analysis efforts, empowering their status of champions for new solutions.
Collecting, extracting, formatting, and analyzing insights for enhanced data driven decision making in business was once an all-encompassing task, which naturally delayed the entire data decision making process. Working with a team who knows the data you are working with opens the door to helpful and insightful feedback.
In the process, we will use an online data visualization software that lets us interact with, and drill deeper into bits and pieces of relevant data. Your Chance: Want to test professional business reporting software? Let’s get started. Explore our 14-day free trial. Benefit from great business reports today!
Today, there are online data visualization tools that make it easy and fast to build powerful market-centric research dashboards. Your Chance: Want to test a market research reporting software? How To Present Your Results: 3 Market Research Example Dashboards. You can also modify each, and use it as a client dashboard.
Datacollection is nothing new, but the introduction of mobile devices has made it more interesting and efficient. But now, mobile datacollection means information can be digitally recording on the mobile device at the source of its origin, eliminating the need for data entry after the information is collected.
Understanding and tracking the right software delivery metrics is essential to inform strategic decisions that drive continuous improvement. Wikipedia defines a software architect as a software expert who makes high-level design choices and dictates technical standards, including software coding standards, tools, and platforms.
Beyond the autonomous driving example described, the “garbage in” side of the equation can take many forms—for example, incorrectly entered data, poorly packaged data, and datacollected incorrectly, more of which we’ll address below. Why is high-quality and accessible data foundational?
2) How To Interpret Data? 3) Why Data Interpretation Is Important? 4) Data Analysis & Interpretation Problems. 5) Data Interpretation Techniques & Methods. 6) The Use of Dashboards For Data Interpretation. Business dashboards are the digital age tools for big data. What is the keyword?
Benefits Of Big Data In Logistics Before we look at our selection of practical examples and applications, let’s look at the benefits of big data in logistics – starting with the (not so) small matter of costs. Your Chance: Want to test a professional logistics analytics software?
If you’re already a software product manager (PM), you have a head start on becoming a PM for artificial intelligence (AI) or machine learning (ML). Why AI software development is different. AI products are automated systems that collect and learn from data to make user-facing decisions. We know what “progress” means.
Without real-time insight into their data, businesses remain reactive, miss strategic growth opportunities, lose their competitive edge, fail to take advantage of cost savings options, don’t ensure customer satisfaction… the list goes on. Try our professional BI software for 14 days, completely free! Actually, it usually isn’t.
Datacollection is nothing new, but the introduction of mobile devices has made it more interesting and efficient. But now, mobile datacollection means information can be digitally recording on the mobile device at the source of its origin, eliminating the need for data entry after the information is collected.
AI refers to the autonomous intelligent behavior of software or machines that have a human-like ability to make decisions and to improve over time by learning from experience. Such innovations offer the ability to transfer data over a network, creating valuable experiences for both the consumer and the business itself.
Business intelligence software will be more geared towards working with Big Data. Data Governance. One issue that many people don’t understand is data governance. The growing number of business intelligence innovations means that the amount of personnel relying on data will grow. Prescriptive Analytics.
BI tools access and analyze data sets and present analytical findings in reports, summaries, dashboards, graphs, charts, and maps to provide users with detailed intelligence about the state of the business. Business intelligence examples Reporting is a central facet of BI and the dashboard is perhaps the archetypical BI tool.
Among the tools that have emerged from this digital transformation, IoT dashboards stand out as invaluable assets. In this article, we will explore the concept of IoT dashboards, delve into their benefits, examine real-life examples, and highlight the essential features that make them indispensable in the IoT landscape.
Today, employee output is no longer represented by vague descriptions, but by isolated figures that offer insight for improvement in specific areas, which can be found on an HR dashboard. Your Chance: Want to test a professional KPI tracking software? Your Chance: Want to test a professional KPI tracking software?
Implementing such solutions could be the key to a new era of productivity for your organization, but implementing new and expansive IT software can be intimidating. Choosing the right MES software: 12 things to think about Selecting manufacturing execution system (MES) software is a critical decision for any manufacturing organization.
Advancement in big data technology has made the world of business even more competitive. The proper use of business intelligence and analytical data is what drives big brands in a competitive market. Business intelligence tools can include data warehousing, data visualizations, dashboards, and reporting.
The answer is through a KPI management system based on professional KPI software. It is important to think deeply and collectively about best practices to manage KPIs. Your Chance: Want to test a KPI management software for free? If data doesn’t start regularly flowing once the trial has begun, there may be something amiss.
Your Chance: Want to try a professional BI analytics software? The main use of business intelligence is to help business units, managers, top executives, and other operational workers make better-informed decisions backed up with accurate data. Your Chance: Want to try a professional BI analytics software?
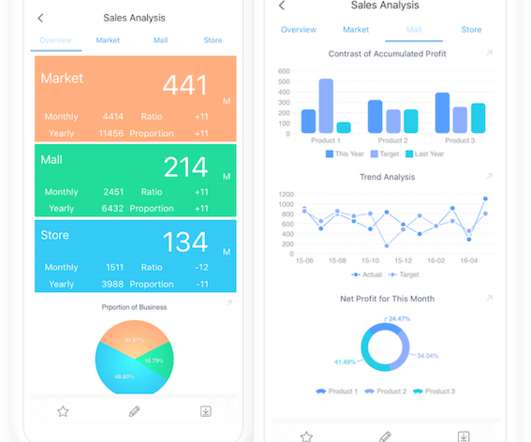
Are you still using the traditional cumbersome and redundant datacollection methods? Have you ever neglected key indicators because of irrelevant data in your decision-making? No need to be worried anymore, all these management problems could be settled with digital dashboard. Digital dashboardsoftware.
Leading companies make use of KPIs and KPI dashboards to measure their efficiency in real time. This allows management to quickly make informed decisions that are backed up by data. We just track them with higher precision and accuracy using specialized KPI dashboards. How an Operations Dashboard Can Streamline Your Reporting.
Sisense analytic software is designed to handle all different kinds of data , so this is a good choice if you have a very unique business model. It is a capable tool for any size scenario, and users like how easy it is to transfer data with a drag-and-drop interface similar to PC desktops.
In today’s dynamic business environment, gaining comprehensive visibility into financial data is crucial for making informed decisions. This is where the significance of a financial dashboard shines through. What is A Financial Dashboard? You can download FineReport for free and have a try!
As we look ahead to 2022, there are four key trends that organizations should be aware of when it comes to big data: cloud computing, artificial intelligence, automated streaming analytics, and edge computing. Each of these trends will continue to shape the way companies use data in the coming years.
Besides, reporting solutions support managers put together a picture of the relevant data and discover business insides. For most companies, the staffs spend 50% time on datacollection, 30% time on checking and approving the data, 15% time on developing and publishing the reports, and 5% on business analysis.
Thus, one tool that has gained significant popularity in recent years is the Project Management Dashboard. Moreover, the implementation of an effective Project Management Dashboard facilitates data-driven decision-making and sustainable business success. What Is A Project Management Dashboard?
BI focuses on descriptive analytics, datacollection, data storage, knowledge management, and data analysis to evaluate past business data and better understand currently known information. Whereas BI studies historical data to guide business decision-making, business analytics is about looking forward.
Overall, as users’ data sources become more extensive, their preferences for BI are changing. They prefer self-service development, interactive dashboards, and self-service data exploration. To put it bluntly, users increasingly want to do their own data analysis without having to find support from the IT department.
Provide a new way of data discovery. New datacollection technologies like devices for Internet of Things (IoT) are providing companies with massive amounts of real-time data. This is different from any previous ways of collectingdata. Take the BI software FineReport as an example. Conclusion.
Cutting-edge financial software suites are using automation as much as possible to accelerate business processes, reduce errors, and free up human capital, which can then be put toward other important tasks. Automated datacollection, for example, can be used to deliver faster information and insights to customers in real time.
In this post, we will go over some finance manager KPIs, KRAs and KPIs for a finance department, and how financial reporting software is able to enhance this process. How to Build Finance Department KPI Dashboards. EBITDA and EBITDA growth are best tracked using financial reporting software as they are very data intensive.
At this time, we can use the dashboard system and reporting system designed by FineReport to effectively solve this problem. The system will automatically process the reported data, and then present the processed data on the designed dashboard. Follow FineReport Reporting Software on Facebook for more information!
Under Quality, the Data Quality Incidents metric measures the average data quality of datasets, while the Active Daily Users metric measures user activity across data platforms. Other data leaders have tried to adapt the IT/software incident metrics world to the data world. Data systems require trust.
Using RPA tools, a company can configure software, or a “robot,” to capture and interpret applications for processing a transaction, manipulating data, triggering responses, and communicating with other digital systems. In some organizations, RPA is a way to modernize old software without replacing it.
Widely recognized in the industry, CALUMO earned top-rankings in the budgeting and planning technology, ease of use, product satisfaction, and additional categories highlighted in the Business Application Research Center’s (BARC) BI & Analytics Survey 21 , the largest annual survey of BI and analytics software users in the industry.
The rising demand for data analysts The data analyst role is in high demand, as organizations are growing their analytics capabilities at a rapid clip. In July 2023, IDC forecast big data and analytics software revenue would hit $122.3 They collect, analyze, and report on data to meet business needs.
With the development of enterprise informatization, there are more and more kinds of data produced, and the demand for reports surges day by day. Let’s discover how to choose a great reporting software and design the architecture to efficiently build a reporting system. Software to Build Reporting System. Reports Portal?
This can be accomplished with dashboards and constituent portals. The smart cities movement refers to the broad effort of municipal governments to incorporate sensors, datacollection and analysis to improve responses to everything from rush-hour traffic to air quality to crime prevention. .
We will also discuss how engineering dashboards are imperative for tracking KPIs and can streamline a reporting process. How to Build Useful KPI Dashboards. However, when you eventually decide to add more engineering performance metrics to your engineering dashboard, there are several things that you should take into consideration.
We organize all of the trending information in your field so you don't have to. Join 42,000+ users and stay up to date on the latest articles your peers are reading.
You know about us, now we want to get to know you!
Let's personalize your content
Let's get even more personalized
We recognize your account from another site in our network, please click 'Send Email' below to continue with verifying your account and setting a password.


Let's personalize your content