Remove Dashboards Remove Data-driven Remove Prescriptive Analytics
article thumbnail

What are decision support systems? Sifting data for better business decisions

CIO Business Intelligence

Decision support systems definition A decision support system (DSS) is an interactive information system that analyzes large volumes of data for informing business decisions. A DSS leverages a combination of raw data, documents, personal knowledge, and/or business models to help users make decisions. ERP dashboards.

article thumbnail

What is the Future of Business Intelligence in the Coming Year?

Smart Data Collective

Business intelligence software will be more geared towards working with Big Data. Data Governance. One issue that many people don’t understand is data governance. It is evident that challenges of data handling will be present in the future too. Prescriptive Analytics. Self-service BI.

Insiders

Sign Up for our Newsletter

This site is protected by reCAPTCHA and the Google Privacy Policy and Terms of Service apply.

article thumbnail

Data Visualization and Visual Analytics: Seeing the World of Data

Sisense

Everyone wants to get more out of their data, but how exactly to do that can leave you scratching your head. Our BI Best Practices demystify the analytics world and empower you with actionable how-to guidance. Data visualization: painting a picture of your data. Thomas, and Kristin A.

article thumbnail

Four starting points to transform your organization into a data-driven enterprise

IBM Big Data Hub

Due to the convergence of events in the data analytics and AI landscape, many organizations are at an inflection point. Furthermore, a global effort to create new data privacy laws, and the increased attention on biases in AI models, has resulted in convoluted business processes for getting data to users. Data governance.

article thumbnail

Monetizing Analytics Features: Why Data Visualizations Will Never Be Enough

Think your customers will pay more for data visualizations in your application? But today, dashboards and visualizations have become table stakes. Discover which features will differentiate your application and maximize the ROI of your embedded analytics. Brought to you by Logi Analytics. Five years ago they may have.

article thumbnail

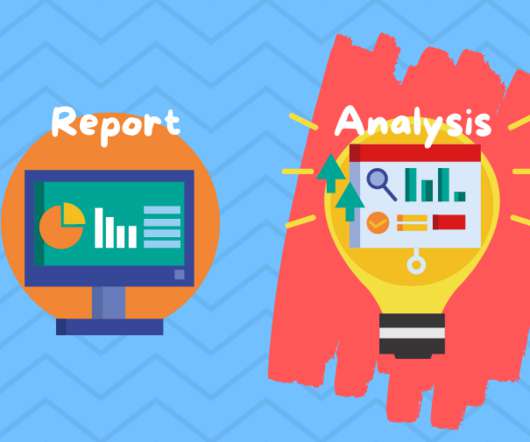
Reporting vs Analytics: Why Different & Which is More Needed?

FineReport

At first glance, reports and analytics may look similar – lots of charts, graphs, trend lines, tables, statistics derived from data. Reports VS Analytics. Definitions : Reporting vs Analytics. Reporting refers to the process of taking factual data and presents it in an organized form. So what is the difference?

article thumbnail

Themes and Conferences per Pacoid, Episode 10

Domino Data Lab

Co-chair Paco Nathan provides highlights of Rev 2 , a data science leaders summit. We held Rev 2 May 23-24 in NYC, as the place where “data science leaders and their teams come to learn from each other.” Nick Elprin, CEO and co-founder of Domino Data Lab. First item on our checklist: did Rev 2 address how to lead data teams?