This site uses cookies to improve your experience. To help us insure we adhere to various privacy regulations, please select your country/region of residence. If you do not select a country, we will assume you are from the United States. Select your Cookie Settings or view our Privacy Policy and Terms of Use.
Cookie Settings
Cookies and similar technologies are used on this website for proper function of the website, for tracking performance analytics and for marketing purposes. We and some of our third-party providers may use cookie data for various purposes. Please review the cookie settings below and choose your preference.
Used for the proper function of the website
Used for monitoring website traffic and interactions
Cookie Settings
Cookies and similar technologies are used on this website for proper function of the website, for tracking performance analytics and for marketing purposes. We and some of our third-party providers may use cookie data for various purposes. Please review the cookie settings below and choose your preference.
Strictly Necessary: Used for the proper function of the website
Performance/Analytics: Used for monitoring website traffic and interactions
The post Guide For Data Analysis: From Data Extraction to Dashboard appeared first on Analytics Vidhya. Unlike hackathons, where we are supposed to come up with a theme-oriented project within the stipulated time, blogathons are different. Blogathons are competitions that are conducted for over a month […].
An online BI dashboard. Thanks to specific business intelligence best practices for dashboard design. Exclusive Bonus Content: Download Our Free Dashboard Checklist! Get the free guide with great tips for your dashboard implementation! What Is The Definition Of A BI Dashboard? How can you create one?
If you want to convey crucial information to decision-makers in the easiest and most effective way possible, you need to embrace the power of interactive dashboards. A business dashboard offers at-a-glance insights based on key performance indicators (KPIs) and is an intuitive and visually pleasing way to consume data.
BI software offers enterprise businesses the opportunity to connect disparate data sources into one unified source, collate and structure the data, and offer an interface for end-users to extract reports and dashboards that can drive more informed business decisions. Let’s introduce the concept of datamining.
Data exploded and became big. Spreadsheets finally took a backseat to actionable and insightful data visualizations and interactive business dashboards. The rise of self-service analytics democratized the data product chain. It’s an extension of datamining which refers only to past data.
The output data of both terms also vary. While BI outputs information through data visualization, online dashboards , and reporting, data warehouse outlines data in dimension and fact tables for upstream applications (or BI tools). Get the short and sweet version with our completely free summary!
Business analytics is a subset of data analytics. Data analytics is used across disciplines to find trends and solve problems using datamining , data cleansing, data transformation, data modeling, and more. Business analytics dashboard components. Business analytics techniques.
BI tools access and analyze data sets and present analytical findings in reports, summaries, dashboards, graphs, charts, and maps to provide users with detailed intelligence about the state of the business. Business intelligence examples Reporting is a central facet of BI and the dashboard is perhaps the archetypical BI tool.
ERP dashboards. Decision support systems are generally recognized as one element of business intelligence systems, along with data warehousing and datamining. These systems are often paired with datamining to sift through databases to produce data content relationships. Clinical DSS. TIBCO Spotfire.
What Is A Data Analysis Method? Data analysis method focuses on strategic approaches to taking raw data, mining for insights that are relevant to the business’s primary goals, and drilling down into this information to transform metrics, facts, and figures into initiatives that benefit improvement. Answer your questions.
While using a business dashboard, all your information can be simplified into a single place, making the time for meaningful decisions much faster. Visual insights : Thanks to modern data visualizations, organizations can monitor productivity and spot trends in an interactive way.
With a MySQL dashboard builder , for example, you can connect all the data with a few clicks. This hands-on classic guides readers through creating reliable queries for virtually any modern SQL-based database, which you can also use as a means to build your own SQL dashboard.
Before we dive in, let’s define strands of AI, Machine Learning and Data Science: Business intelligence (BI) leverages software and services to transform data into actionable insights that inform an organization’s strategic and tactical business decisions. What is the CRISP-DM methodology?
This interdisciplinary field of scientific methods, processes, and systems helps people extract knowledge or insights from data in a host of forms, either structured or unstructured, similar to datamining. A must-explore book for data science that is as intriguing as it is rewarding.
A BI dashboard — or business intelligence dashboard — is an information management tool that uses data visualization to display KPIs (key performance indicators) tracked by a business to assess various aspects of performance. Defining business dashboard needs. Several BI dashboards are available in the market.
Data analytics draws from a range of disciplines — including computer programming, mathematics, and statistics — to perform analysis on data in an effort to describe, predict, and improve performance. What are the four types of data analytics? Data analytics includes the tools and techniques used to perform data analysis.
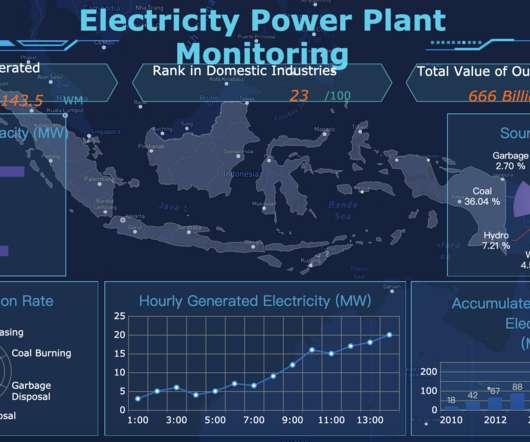
Kalau berbicara tentang dashboard, Anda mungkin berpikir tentang panel instrumen di pesawat atau dashboard mobil, dimana pengemudi memantau fungsi utama secara sekilas melalui instrumen cluster. Dalam bidang inteligensi bisnis, dashboard bisnis memiliki peran yang serupa. Apa Itu Dashboard Bisnis? Fitur Dashboard Bisnis.
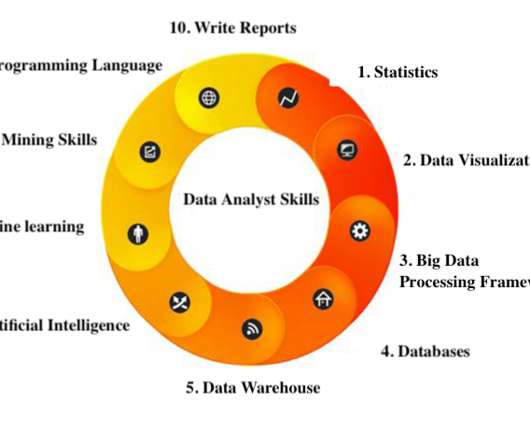
Framework Big Data Processing: Hadoop, storm, spark. Data Warehous: SSIS, SSAS. Skill DataMining: Matlab, R, Python. Seperti yang Anda ketahui, statistik adalah dasar analisis data. Statistik juga adalah sebuah skill utama seorang data analyst. Anda perlu memahami prinsip dibalik data.
A BI dashboard — or business intelligence dashboard — is an information management tool that uses data visualization to display KPIs (key performance indicators) tracked by a business to assess various aspects of performance. DEFINING BUSINESS DASHBOARD NEEDS. Several BI dashboards are available in the market.
Datamining technology has become very important for modern businesses. Companies use datamining technology for a variety of purposes. One of the most important is collecting revenue data to draft financial statements, forecast future sales and make decisions to address revenue shortfalls.
She applies some calculations and forwards the file to a data engineer who loads the data into a database and runs a Talend job that performs ETL to dimensionalize the data and produce a Data Mart. The data engineer then emails the BI Team, who refreshes a Tableau dashboard.
Definition: BI vs Data Science vs Data Analytics. Business Intelligence describes the process of using modern data warehouse technology, data analysis and processing technology, datamining, and data display technology for visualizing, analyzing data, and delivering insightful information.
You can procure data from analytics tools to optimize your landing pages to maximize conversions. You can use data analytics dashboards on your digital advertising platforms to focus on the best converting traffic, such as the PPC keywords that drive the most sales. Use DataMining to Find the Best Strategies for Local SEO.
You can use datamining tools to evaluate feedback from customer surveys and other resources that will help you get a better understanding of their expectations. You can also use your own data analytics dashboards to see what customers are telling you. Use DataMining to Hone Your Content Creation Skills.
And it’s data, and property binding requires too much time to fix in the report. KNIME is an open-source BI tool specialized for data linkage, integration, and analysis. It provides data scientists and BI executives with datamining, machine learning, and data visualization capabilities to build effective data pipelines. .
To fill the gap, marketing BI builds a solid foundation for business users to make use of massive data. For instance, Self-service BI allows business users to access and explore data sets even if they do not have a background in BI or related fields such as datamining and statistics. Welcome to have a free trial.
CompTIA Data+ The CompTIA Data+ certification is an early-career data analytics certification that validates the skills required to facilitate data-driven business decision-making. They can visualize and present data findings in dashboards, presentations, and commonly used visualization platforms.
If nothing can be changed, there is no point of analyzing data. But if you find a development opportunity, and see that your business performance can be significantly improved, then a KPI dashboard software could be a smart investment to monitor your key performance indicators and provide a transparent overview of your company’s data.
In a slightly more technically-driven role, a BI developer is responsible for building, creating, or improving BI-driven solutions that help analysts transform data into knowledge, including datadashboards. The role of a business intelligence engineer is incredibly rich, varied, and demanding.
When you have the data in hand, you can make decisions with greater accuracy. You only need to define your goals and specify the data sources. The tool will collect, refine, and present the data into an easy to understand dashboard. 2- SEMrush For SEO.
The results appear in a collection of dashboards or automated graphical visualizations. Highlights: Focus on AI is best for problems that require complex solutions that adapt to incoming data. The product line is broken into tools for basic exploration such as Visual DataMining or Visual Forecasting.
According to the definition, business intelligence and analytics refer to the data management solutions implemented in companies to collect, analyze and drive insights from data. BI Dashboard (by FineReport). Note: the reports and dashboards samples used here are made with FineReport. Dashboard(by FineReport).
Search engines use datamining tools to find links from other sites. They use a sophisticated data-driven algorithm to assess the quality of these sites based on the volume and quantity of inbound links. How Can Big Data Assist With LinkBuilding? Big data is critical for linkbuilding in 2020.
You can use extract social data to see how many people usually participate in various events. You can also datamine testimonials about various meetings, so you can derive better insights about the benefits people have gotten from them. Social media analytics makes it easier to get the most of your networking opportunities.
Monitoring can rely on reports issued over time, but it generally uses graphical or visual dashboards that clearly illustrate how the metrics change from baseline values over time. Organizations increasingly see value in making data-driven or analytic decisions. Not data, not reports, not dashboards.
Business intelligence (BI) leverages data analysis to form actionable insights that inform an organization’s strategic and tactical business decisions. DataMining. In practical applications, datamining is also used to mine the past and predict the future. DASHBOARD REPORTING (by FineReport).
They can use data on online user engagement to optimize their business models. They are able to utilize Hadoop-based datamining tools to improve their market research capabilities and develop better products. Companies that use big data analytics can increase their profitability by 8% on average.
The best way to do this is by using the conversion reports and audience insights in the analytics dashboards of your email marketing platform. The data here will help you optimize your list-building strategy. You can also use datamining tools like SEMRush to identify the best blogs to submit guest posts.
LinkedIn is one of the platforms that helps people use big data to facilitate online marketing. You can use their sophisticated analytics dashboard to improve your marketing strategies. However, there are other ways to use big data to get the most of your LinkedIn marketing strategy.
They’re often responsible for building algorithms for accessing raw data, too, but to do this, they need to understand a company’s or client’s objectives, as aligning data strategies with business goals is important, especially when large and complex datasets and databases are involved.
Data engineers are often responsible for building algorithms for accessing raw data, but to do this, they need to understand a company’s or client’s objectives, as aligning data strategies with business goals is important, especially when large and complex datasets and databases are involved.
By collecting and analyzing data from different channels, educational institutions can get more tangible results. Big data technology in education primarily concerns datamining, analytics, and web dashboards. The use of big data improves teaching and helps to identify opportunities.
Advanced analytics—which includes datamining, big data, and predictive data analytics—affords you the ability to gather deeper, more strategic, and ultimately more actionable insights from your data. No need to be a developer or call IT to create your reports.
A BI dashboard — or business intelligence dashboard — is an information management tool that uses data visualization to display KPIs (key performance indicators) tracked by a business to assess various aspects of performance. DEFINING BUSINESS DASHBOARD NEEDS. Several BI dashboards are available in the market.
We organize all of the trending information in your field so you don't have to. Join 42,000+ users and stay up to date on the latest articles your peers are reading.
You know about us, now we want to get to know you!
Let's personalize your content
Let's get even more personalized
We recognize your account from another site in our network, please click 'Send Email' below to continue with verifying your account and setting a password.


Let's personalize your content