This site uses cookies to improve your experience. To help us insure we adhere to various privacy regulations, please select your country/region of residence. If you do not select a country, we will assume you are from the United States. Select your Cookie Settings or view our Privacy Policy and Terms of Use.
Cookie Settings
Cookies and similar technologies are used on this website for proper function of the website, for tracking performance analytics and for marketing purposes. We and some of our third-party providers may use cookie data for various purposes. Please review the cookie settings below and choose your preference.
Used for the proper function of the website
Used for monitoring website traffic and interactions
Cookie Settings
Cookies and similar technologies are used on this website for proper function of the website, for tracking performance analytics and for marketing purposes. We and some of our third-party providers may use cookie data for various purposes. Please review the cookie settings below and choose your preference.
Strictly Necessary: Used for the proper function of the website
Performance/Analytics: Used for monitoring website traffic and interactions
CFO dashboards exist to enhance the strategic as well as the analytical efforts related to every financial aspect of your business. Here, we’ll explore the dynamics of reports for CFOs, look at CFO reporting tools, and consider real-world examples of both CFO dashboards and reports. Benefit from great CFO dashboards & reports!
By taking an online data visualization approach to handling your company’s strategic activities, big or small, you will make your business more cohesive, collaborative, intelligent and profitable – and project management dashboards will help you do just that. Download right here our free guide and get started with dashboards!
Soon businesses of all sizes will have so much amount of information that dashboard software will be the most invaluable resource a company can have. That’s why we welcome you to the world of interactive dashboards. Your Chance: Want to test interactive dashboard software for free? What Is An Interactive Dashboard?
Digital dashboards not only help you to drill down into the insights that matter most to your business, but they also offer an interactive visual representation that assists in swifter, more informed decision-making as well as the discovery of priceless new insights. Your Chance: Want to build your own digital dashboard with a few clicks?
2) Benefits Of White Label Reports 3) Key White Label Reporting Features 4) White Label Dashboards & Report Examples In today’s competitive business environment, building a brand that is trusted, recognizable, and loved by many is not an easy task. Your Chance: Want to build your own white label reports & dashboards?
Customers across diverse industries rely on Amazon OpenSearch Service for interactive log analytics, real-time application monitoring, website search, vector database, deriving meaningful insights from data, and visualizing these insights using OpenSearch Dashboards. The requested data is sent to the OpenSearch Dashboards server.
Refer to this developer guide to understand more about index snapshots Understanding manual snapshots Manual snapshots are point-in-time backups of your OpenSearch Service domain that are initiated by the user. The bucket has to be in the same Region where the OpenSearch Service domain is hosted. Snapshots are not instantaneous.
Business intelligence concepts refer to the usage of digital computing technologies in the form of data warehouses, analytics and visualization with the aim of identifying and analyzing essential business-based data to generate new, actionable corporate insights. Data dashboarding and reporting. 4) Data dashboarding and reporting.
This interdisciplinary field of scientific methods, processes, and systems helps people extract knowledge or insights from data in a host of forms, either structured or unstructured, similar to data mining. Data science, also known as data-driven science, covers an incredibly broad spectrum.
To help you understand the potential of analysis and how you can use it to enhance your business practices, we will answer a host of important analytical questions. For a look at the power of software for the purpose of data analysis and to enhance your methods of analyzing data, glance over our selection of dashboard examples.
The workflow consists of the following initial steps: OpenSearch Service is hosted in the primary Region, and all the active traffic is routed to the OpenSearch Service domain in the primary Region. We refer to this role as TheSnapshotRole in this post. On OpenSearch Dashboards, navigate to the main menu and choose Security.
3) “The Big Book Of Dashboards: Visualizing Your Data Using Real-World Business Scenarios” by Steve Waxler, Jeffrey Shaffer, and Andy Cotgreave. Our next best book to learn data visualization is the “The Big Book Of Dashboards”. It is a definitive reference for anyone who wants to master the art of dashboarding.
You can use the flexible connector framework and search flow pipelines in OpenSearch to connect to models hosted by DeepSeek, Cohere, and OpenAI, as well as models hosted on Amazon Bedrock and SageMaker. The connector is an OpenSearch construct that tells OpenSearch how to connect to an external model host.
With a MySQL dashboard builder , for example, you can connect all the data with a few clicks. A host of notable brands and retailers with colossal inventories and multiple site pages use SQL to enhance their site’s structure functionality and MySQL reporting processes. Would highly recommend for SQL experts.”.
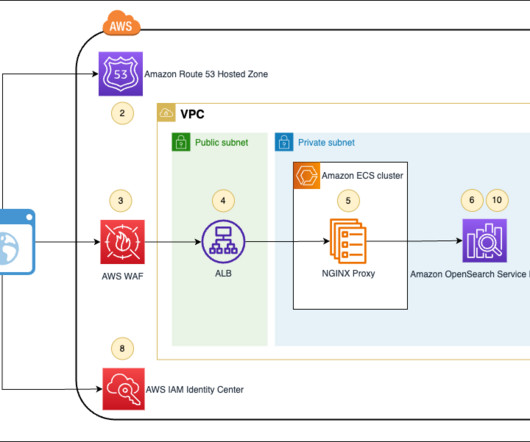
Refer to How can I access OpenSearch Dashboards from outside of a VPC using Amazon Cognito authentication for a detailed evaluation of the available options and the corresponding pros and cons. The workflow consists of the following steps: The user navigates to the OpenSearch Dashboards URL in their browser.
Financial reporting refers to standard practices to give stakeholders an accurate depiction of a company’s finances, including their revenues, expenses, profits, capital, and cash flow, as formal records that provide in-depth insights into financial information. it’s great to have an investor relations dashboard at hand: **click to enlarge**.
For more information on the choice of index algorithm, refer to Choose the k-NN algorithm for your billion-scale use case with OpenSearch. For more details, refer to Amazon OpenSearch Service Construct Library. After you review the cluster configuration, select the jump host as the target for the run command.
Security is a distinct advantage of the PaaS model as the vast majority of such developments perform a host of automatic updates on a regular basis. By reviewing every aspect of platform pricing, a host of companies across niches have grown their audience, connecting with a broader demographic of consumers. 6) Micro-SaaS.
Data quality refers to the assessment of the information you have, relative to its purpose and its ability to serve that purpose. While the digital age has been successful in prompting innovation far and wide, it has also facilitated what is referred to as the “data crisis” – low-quality data.
Here, we will consider the question ‘ What are operational reports,’ delve deeper into strategic reports, and examine a host of best operational reporting analysis practices. With this in mind, we are going to explore operational and strategic reporting. Let’s begin. Exclusive Bonus Content: Take Advantage Of Our Free Summary! Order Accuracy.
In this post, we show how to ingest CSV files from Amazon Simple Storage Service (Amazon S3) into Amazon OpenSearch Service using the Amazon OpenSearch Ingestion feature and visualize the ingested data using OpenSearch Dashboards. Additionally, we demonstrate how to visualize the ingested data using OpenSearch Dashboards.
AI refers to the autonomous intelligent behavior of software or machines that have a human-like ability to make decisions and to improve over time by learning from experience. The device mesh refers to an expanding set of endpoints people use to access applications and information. So, what is this most intriguing of tech buzzwords?
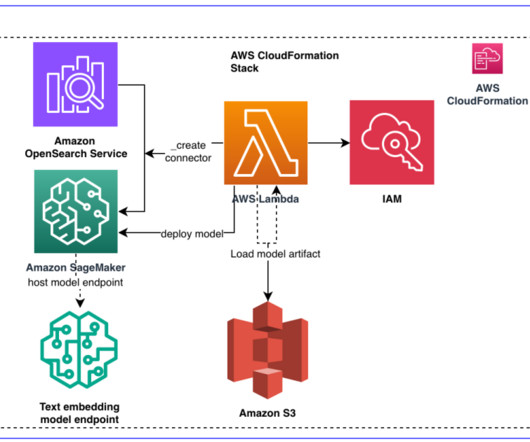
For more information, refer to Introduction to OpenSearch Models. Map an AWS Identity and Access Management (IAM) role by the name LambdaInvokeOpenSearchMLCommonsRole as the backend role on the ml_full_access role using the Security plugin on OpenSearch Dashboards, as shown in the following video.
” I, thankfully, learned this early in my career, at a time when I could still refer to myself as a software developer. Especially when you consider how Certain Big Cloud Providers treat autoML as an on-ramp to model hosting. Is autoML the bait for long-term model hosting? But that’s a story for another day.)
BI tools access and analyze data sets and present analytical findings in reports, summaries, dashboards, graphs, charts, and maps to provide users with detailed intelligence about the state of the business. Business intelligence examples Reporting is a central facet of BI and the dashboard is perhaps the archetypical BI tool.
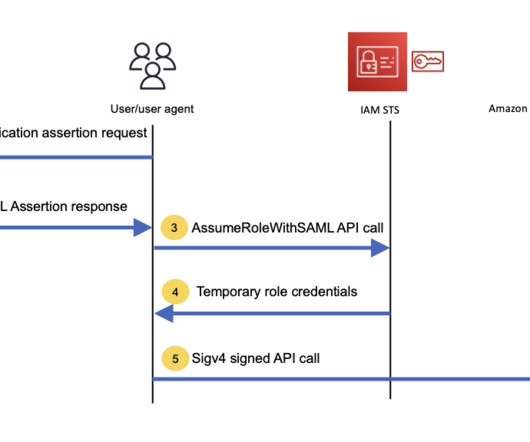
Customers of Amazon OpenSearch Service can already use Security Assertion Markup Language (SAML) to access OpenSearch Dashboards. To configure your IdP of choice as the SAML IdP for IAM, refer to Creating IAM SAML identity providers. To configure OpenSearch Service, refer to SAML authentication for OpenSearch Dashboards.
Key performance indicators (KPIs) of interest for a call center from a near-real-time platform could be calls waiting in the queue, highlighted in a performance dashboard within a few seconds of data ingestion from call center streams. The near-real-time insights can then be visualized as a performance dashboard using OpenSearch Dashboards.
These reports are more digestible when they are generated through online data visualization tools that have numerous interactive dashboard features, to ensure that your business has the right meaningful financial data. This metric is also referred to as “EBIT”, for “earnings before interest and tax”.
Better yet, implement a team KPI dashboard that will show you immediately how your team is performing and where do you need to allocate more resources ( educational materials or workshops ) so that the whole department has more chance to improve their results. Exclusive Bonus Content: The What, the Why and the How: A Summary.
In this fast-paced world, Kinesis Data Streams stands out as a versatile and robust solution to tackle a wide range of use cases with real-time data, from dashboarding to powering artificial intelligence (AI) applications. Connectivity between a QuickSight dashboard and Amazon Redshift enables you to deliver visualization and insights.
White labeling and embedding analytics tools and methodologies enhance interpretive capabilities, solve targeted challenges, address risks, and offer personalized real-time analytical solutions through smart modern real-time dashboard tools. This means the login page, at the top of the dashboards, the favicon, and other relevant spots.
Data intelligence refers to every analytical tool and activity based on forming a better understanding of the information and data a company (or business) collects, analyzing and utilizing it with the goal of enhancing and evolving business processes. Download right here our guide, and find out everything you need to know! click to enlarge**.
Users search, explore, and analyze the data with OpenSearch Dashboards. Refer to Getting started with Amazon OpenSearch Service to create a provisioned OpenSearch Service domain. Use OpenSearch dashboards to map a pipeline role to an appropriate backend role. The sources, as producers, write data into Amazon MSK.
Here, we’ll explore customer data management, offering a host of practical tips to help you embrace the power of customer data management software the right way. Centered on leveraging consumer insights to improve your strategies and communications by using a highly data-driven process can also be referred to as Customer Intelligence (CI).
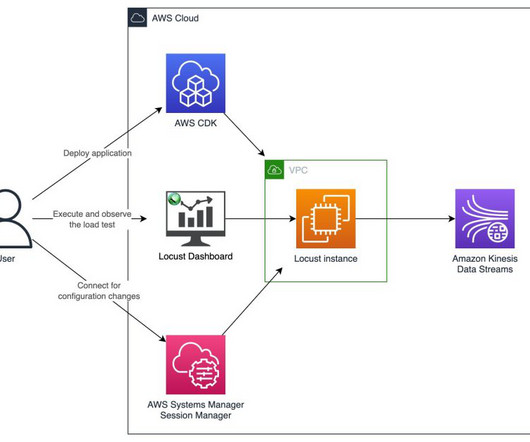
For more information on the KDG, refer to Test Your Streaming Data Solution with the New Amazon Kinesis Data Generator.) You can access the Locust dashboard to perform and observe the load test and connect via Session Manager , a capability of AWS Systems Manager , for configuration changes.
OpenSearch hosts – Provide the OpenSearch Service domain endpoint for the host and provide the preferred index name to store the data. For more information, refer to Securing Amazon OpenSearch Ingestion pipelines within a VPC. For creating and updating documents on Amazon DocumentDB, refer to Working with Documents.
There are a host of benefits to procurement reporting. With the help of a dashboard designer , you can simply drag-and-drop your values and create interactive visualizations that will point out errors immediately. That way you will be able to significantly reduce errors, and increase your productivity levels. Clean your data.
Amazon OpenSearch Serverless helps you index, analyze, and search your logs and data using OpenSearch APIs and dashboards. API and dashboard clients can access the collections from public networks or one or more VPCs. For VPC access to collections and dashboards, you can create VPC endpoints.
Snapshot Management helps you create point-in-time backups of your domain using OpenSearch Dashboards, including both data and configuration settings (for visualizations and dashboards). For more information, refer to Prerequisites. Provide your host name, Region, snapshot repo name, and S3 bucket. sts = boto3.Session().client("sts")
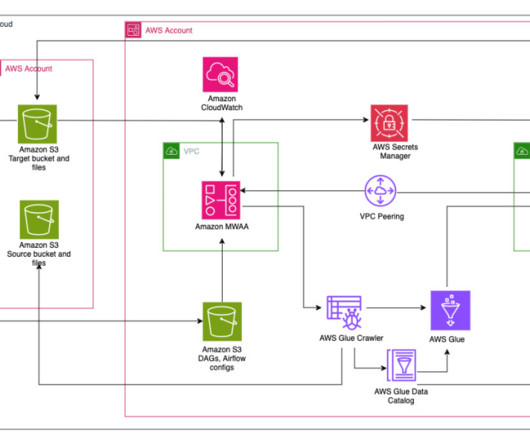
Apache Airflow is an open source tool used to programmatically author, schedule, and monitor sequences of processes and tasks, referred to as workflows. In the second account, Amazon MWAA is hosted in one VPC and Redshift Serverless in a different VPC, which are connected through VPC peering. A VPC gateway endpointto Amazon S3.
Prerequisites Refer to Security in OpenSearch Ingestion to set up the permissions you need to create a pipeline and write to a pipeline, and the permissions the pipeline needs to write to a sink. For more information, refer to Data Prepper. We use this feature to create a trace pipeline.
We then use Amazon Managed Grafana to create dashboards and view these metrics using an Amazon Managed Service for Prometheus workspace as its data source. For instructions, refer to Enable IAM Identity Center. For instructions, refer to Create a key pair using Amazon EC2. We need this to create dashboards.
Amazon’s Open Data Sponsorship Program allows organizations to host free of charge on AWS. For more information, refer to Guidance for Distributed Computing with Cross Regional Dask on AWS and the GitHub repo for open-source code. These datasets are distributed across the world and hosted for public use.
dbt Cloud is a hosted service that helps data teams productionize dbt deployments. For the purposes of this post, use a dbt Cloud-hosted managed repository. Scheduling a job is sometimes referred to as deploying a project. Expand the database aurora_zeroetl , schema demodb and you should see 7 tables being created.
We organize all of the trending information in your field so you don't have to. Join 42,000+ users and stay up to date on the latest articles your peers are reading.
You know about us, now we want to get to know you!
Let's personalize your content
Let's get even more personalized
We recognize your account from another site in our network, please click 'Send Email' below to continue with verifying your account and setting a password.


Let's personalize your content