

Amazon OpenSearch Service launches flow builder to empower rapid AI search innovation
AWS Big Data
MAY 2, 2025
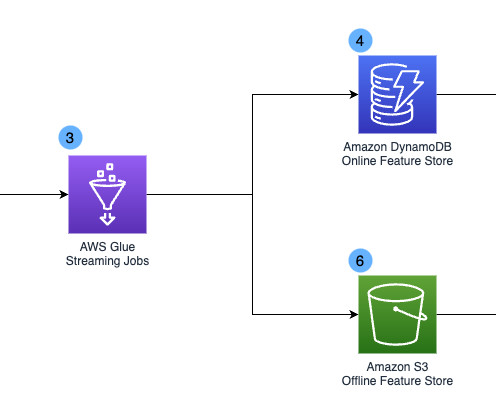
This middleware consists of custom code that runs data flows to stitch data transformations, search queries, and AI enrichments in varying combinations tailored to use cases, datasets, and requirements. Ingest flows are created to enrich data as its added to an index. Flows are a pipeline of processor resources.


Let's personalize your content