This site uses cookies to improve your experience. To help us insure we adhere to various privacy regulations, please select your country/region of residence. If you do not select a country, we will assume you are from the United States. Select your Cookie Settings or view our Privacy Policy and Terms of Use.
Cookie Settings
Cookies and similar technologies are used on this website for proper function of the website, for tracking performance analytics and for marketing purposes. We and some of our third-party providers may use cookie data for various purposes. Please review the cookie settings below and choose your preference.
Used for the proper function of the website
Used for monitoring website traffic and interactions
Cookie Settings
Cookies and similar technologies are used on this website for proper function of the website, for tracking performance analytics and for marketing purposes. We and some of our third-party providers may use cookie data for various purposes. Please review the cookie settings below and choose your preference.
Strictly Necessary: Used for the proper function of the website
Performance/Analytics: Used for monitoring website traffic and interactions
Introduction Organizations are turning to cloud-based technology for efficient data collecting, reporting, and analysis in today’s fast-changing business environment. Data and analytics have become critical for firms to remain competitive.
Gathering data and information from one or multiple platforms and creating a comprehensive social media dashboard is equally important as creating the social content itself. Your Chance: Want to test a social media dashboard software for free? Benefit from professional social dashboards! What Is A Social Media Dashboard?
While Capital One Software has focused specifically on Snowflake AI Data Cloud environments, the company announced in June 2024 that it intends to adapt Slingshot to the Databricks’ Data Intelligence Platform to address cost management. These were amongst the concerns that prompted the development of Capital One Slingshot.
One of the BI architecture components is data warehousing. Organizing, storing, cleaning, and extraction of the data must be carried by a central repository system, namely datawarehouse, that is considered as the fundamental component of business intelligence. What Is Data Warehousing And Business Intelligence?
Business intelligence concepts refer to the usage of digital computing technologies in the form of datawarehouses, analytics and visualization with the aim of identifying and analyzing essential business-based data to generate new, actionable corporate insights. The datawarehouse. 1) The raw data.
Organizations face various challenges with analytics and business intelligence processes, including data curation and modeling across disparate sources and datawarehouses, maintaining data quality and ensuring security and governance.
Amazon Redshift , launched in 2013, has undergone significant evolution since its inception, allowing customers to expand the horizons of data warehousing and SQL analytics. Industry-leading price-performance Amazon Redshift offers up to three times better price-performance than alternative cloud datawarehouses.
Introduction Companies can access a large pool of data in the modern business environment, and using this data in real-time may produce insightful results that can spur corporate success. Real-time dashboards such as GCP provide strong data visualization and actionable information for decision-makers.
We’ll share why in a moment, but first, we want to look at a historical perspective with what happened to datawarehouses and data engineering platforms. Lessons Learned from DataWarehouse and Data Engineering Platforms. This is an open question, but we’re putting our money on best-of-breed products.
While customers can perform some basic analysis within their operational or transactional databases, many still need to build custom data pipelines that use batch or streaming jobs to extract, transform, and load (ETL) data into their datawarehouse for more comprehensive analysis.
Amazon Redshift is a fast, scalable, secure, and fully managed cloud datawarehouse that lets you analyze your data at scale. Amazon Redshift Serverless lets you access and analyze data without the usual configurations of a provisioned datawarehouse. Choose a query to view it in Query profiler.
Dashboard reporting refers to putting the relevant business metrics and KPIs in one interface, presenting them visually, dynamic, and in real-time, in the dashboard formats. This article will review the best 10 dashboard tools covering different areas, including open source and free software. What Makes a Great Dashboard?
Fortunately, there are a few quick fixes that you can try to help optimize looker performance and improve dashboard load times. 1 – Limit the number of dashboard elements. You can also use aggregate awareness to dramatically boost entire dashboards’ performance, which significantly improves load times.
Amazon Redshift Serverless makes it simple to run and scale analytics without having to manage your datawarehouse infrastructure. He works with customers and engineering teams to build new features that enable data engineers and data analysts to more easily load data, manage datawarehouse resources, and query their data.
Amazon Redshift is a fast, scalable, secure, and fully managed cloud datawarehouse that you can use to analyze your data at scale. This enables you to integrate web-based applications to access data from Amazon Redshift using an API to run SQL statements. Building a serverless data processing workflow.
Unified access to your data is provided by Amazon SageMaker Lakehouse , a unified, open, and secure data lakehouse built on Apache Iceberg open standards. The final model provides sales teams with the highest-value opportunities, which they can visualize in a business intelligence dashboard and take action on immediately.
a) Data Connectors Features. c) Dashboard Features. For a few years now, Business Intelligence (BI) has helped companies to collect, analyze, monitor, and present their data in an efficient way to extract actionable insights that will ensure sustainable growth. c) Join Data Sources. 3) Dashboards.
Ad hoc reporting, also known as one-time ad hoc reports, helps its users to answer critical business questions immediately by creating an autonomous report, without the need to wait for standard analysis with the help of real-time data and dynamic dashboards. Easy to use: .
Amazon Redshift is a fully managed, AI-powered cloud datawarehouse that delivers the best price-performance for your analytics workloads at any scale. To enable the feature, complete the following steps: On the Amazon Redshift console, open the Redshift Serverless dashboard. Choose Query data.
With a MySQL dashboard builder , for example, you can connect all the data with a few clicks. This hands-on classic guides readers through creating reliable queries for virtually any modern SQL-based database, which you can also use as a means to build your own SQL dashboard. Viescas, Douglas J. Steele, and Ben J.
Amazon AppFlow automatically encrypts data in motion, and allows you to restrict data from flowing over the public internet for SaaS applications that are integrated with AWS PrivateLink , reducing exposure to security threats. He has worked with building datawarehouses and big data solutions for over 13 years.
In the following section, two use cases demonstrate how the data mesh is established with Amazon DataZone to better facilitate machine learning for an IoT-based digital twin and BI dashboards and reporting using Tableau. This is further integrated into Tableau dashboards. This led to a complex and slow computations.
In today’s world, datawarehouses are a critical component of any organization’s technology ecosystem. They provide the backbone for a range of use cases such as business intelligence (BI) reporting, dashboarding, and machine-learning (ML)-based predictive analytics, that enable faster decision making and insights.
We realized we needed a datawarehouse to cater to all of these consumer requirements, so we evaluated Amazon Redshift. At the same time, we had to find a way to implement entitlements in our Amazon Redshift datawarehouse with the same set of tags that we had already defined in Lake Formation.
Central to Byrdak’s multi-year transformation plan is the expansion of MealConnect, the first nationally available food rescue and sourcing platform, and a new datawarehouse to anchor an analytics offering that helps food banks analyze and visualize their food sourcing and distribution data.
In addition to increasing the price of deployment, setting up these datawarehouses and processors also impacted expensive IT labor resources. Check out this investor relations dashboard example below, part of our management dashboard series: **click to enlarge**. They also need these tools to generate a true ROI.
Amazon Redshift is the most widely used datawarehouse in the cloud, best suited for analyzing exabytes of data and running complex analytical queries. Amazon QuickSight is a fast business analytics service to build visualizations, perform ad hoc analysis, and quickly get business insights from your data.
times better price-performance than other cloud datawarehouses on real-world workloads using advanced techniques like concurrency scaling to support hundreds of concurrent users, enhanced string encoding for faster query performance, and Amazon Redshift Serverless performance enhancements. Amazon Redshift delivers up to 4.9
Specific business intelligence technologies may include: ad hoc analysis Data querying & discovery Datawarehouse Enterprise reporting Data visualization Dashboards. Also, I will give you some samples on dashboards, ad-hoc analysis, enterprise reporting to help to understand. Datawarehouse.
If you ask an engineer to show how they operate the application in production, they will likely show containers and operational dashboards—not unlike any other software service. Data is at the core of any ML project, so data infrastructure is a foundational concern.
Imagine a data team of one or two dozen data professionals serving the analytics needs of hundreds of sales and marketing team members. They submit an endless list of requests for new data sets, dashboards, segmentations, cached data sets and nearly anything else they think will help them meet business goals.
This stack creates the following resources and necessary permissions to integrate the services: Data stream – With Amazon Kinesis Data Streams , you can send data from your streaming source to a data stream to ingest the data into a Redshift datawarehouse. version cluster. version cluster.
Amazon Redshift is a fully managed, petabyte-scale datawarehouse service in the cloud that delivers powerful and secure insights on all your data with the best price-performance. With Amazon Redshift, you can analyze your data to derive holistic insights about your business and your customers.
BI analysts, with an average salary of $71,493 according to PayScale , provide application analysis and data modeling design for centralized datawarehouses and extract data from databases and datawarehouses for reporting, among other tasks. BI encompasses numerous roles.
Snowflake provides the right balance between the cloud and data warehousing, especially when datawarehouses like Teradata and Oracle are becoming too expensive for their users. It is also easy to get started with Snowflake as the typical complexity of datawarehouses like Teradata and Oracle are hidden from the users. .
In-WarehouseData Prep provides builders with the advanced functionality they need to rapidly transform and optimize raw data creating materialized views on cloud datawarehouses. In-WarehouseData Prep supports both AWS Redshift and Snowflake datawarehouses. Additional capabilities.
In this post, we look at three key challenges that customers face with growing data and how a modern datawarehouse and analytics system like Amazon Redshift can meet these challenges across industries and segments. The Stripe Data Pipeline is powered by the data sharing capability of Amazon Redshift.
This should also include creating a plan for data storage services. Are the data sources going to remain disparate? Or does building a datawarehouse make sense for your organization? Let’s see this with an example of a sales dashboard. Choose a few KPIs and build a few business dashboards as examples.
A DSS leverages a combination of raw data, documents, personal knowledge, and/or business models to help users make decisions. The data sources used by a DSS could include relational data sources, cubes, datawarehouses, electronic health records (EHRs), revenue projections, sales projections, and more.
BI tools access and analyze data sets and present analytical findings in reports, summaries, dashboards, graphs, charts, and maps to provide users with detailed intelligence about the state of the business. Business intelligence examples Reporting is a central facet of BI and the dashboard is perhaps the archetypical BI tool.
Data scientists derive insights from data while business analysts work closely with and tend to the data needs of business units. Business analysts sometimes perform data science, but usually, they integrate and visualize data and create reports and dashboards from data supplied by other groups.
Customers can also implement their own custom dashboards in QuickSight. As part of the Talent Intelligence Platform Eightfold also exposes a data hub where each customer can access their Amazon Redshift-based datawarehouse and perform ad hoc queries as well as schedule queries for reporting and data export.
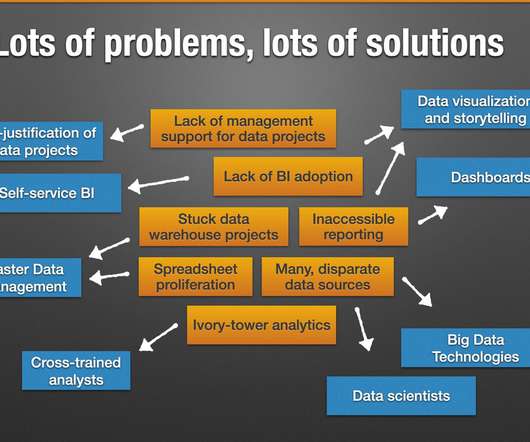
The symptoms we see are varied: lack of management support, lack of end-user adoption; poorly defined requirements; datawarehouse projects that never seem to finish. And for each of these problems, the data industry has crafted different “solutions” or technologies to try to address them. We’ve got a lot to share in this area.
If nothing can be changed, there is no point of analyzing data. But if you find a development opportunity, and see that your business performance can be significantly improved, then a KPI dashboard software could be a smart investment to monitor your key performance indicators and provide a transparent overview of your company’s data.
We organize all of the trending information in your field so you don't have to. Join 42,000+ users and stay up to date on the latest articles your peers are reading.
You know about us, now we want to get to know you!
Let's personalize your content
Let's get even more personalized
We recognize your account from another site in our network, please click 'Send Email' below to continue with verifying your account and setting a password.


Let's personalize your content