This site uses cookies to improve your experience. To help us insure we adhere to various privacy regulations, please select your country/region of residence. If you do not select a country, we will assume you are from the United States. Select your Cookie Settings or view our Privacy Policy and Terms of Use.
Cookie Settings
Cookies and similar technologies are used on this website for proper function of the website, for tracking performance analytics and for marketing purposes. We and some of our third-party providers may use cookie data for various purposes. Please review the cookie settings below and choose your preference.
Used for the proper function of the website
Used for monitoring website traffic and interactions
Cookie Settings
Cookies and similar technologies are used on this website for proper function of the website, for tracking performance analytics and for marketing purposes. We and some of our third-party providers may use cookie data for various purposes. Please review the cookie settings below and choose your preference.
Strictly Necessary: Used for the proper function of the website
Performance/Analytics: Used for monitoring website traffic and interactions
Now with Amazon Bedrock Knowledge Bases integration with structured data, you can use simple, natural language prompts to query complex financial datasets. Developers can rapidly implement sophisticated data querying features without complex codingjust connect to the API endpoints and let users explore financial data using plain English.
Amazon Redshift is a fast, scalable, secure, and fully managed cloud datawarehouse that lets you analyze your data at scale. Amazon Redshift Serverless lets you access and analyze data without the usual configurations of a provisioned datawarehouse. Choose a query to view it in Query profiler.
Amazon AppFlow automatically encrypts data in motion, and allows you to restrict data from flowing over the public internet for SaaS applications that are integrated with AWS PrivateLink , reducing exposure to security threats. He has worked with building datawarehouses and big data solutions for over 13 years.
Whether the reporting is being done by an end user, a data science team, or an AI algorithm, the future of your business depends on your ability to use data to drive better quality for your customers at a lower cost. So, when it comes to collecting, storing, and analyzing data, what is the right choice for your enterprise?
Download our game-changing summary and see your company grow! In addition to increasing the price of deployment, setting up these datawarehouses and processors also impacted expensive IT labor resources. Check out this investor relations dashboard example below, part of our management dashboard series: **click to enlarge**.
Dashboard reporting refers to putting the relevant business metrics and KPIs in one interface, presenting them visually, dynamic, and in real-time, in the dashboard formats. This article will review the best 10 dashboard tools covering different areas, including open source and free software. What Makes a Great Dashboard?
Specific business intelligence technologies may include: ad hoc analysis Data querying & discovery Datawarehouse Enterprise reporting Data visualization Dashboards. Also, I will give you some samples on dashboards, ad-hoc analysis, enterprise reporting to help to understand. Datawarehouse.
Tens of thousands of customers use Amazon Redshift for modern data analytics at scale, delivering up to three times better price-performance and seven times better throughput than other cloud datawarehouses. On the Amazon Redshift console, navigate to the Redshift Serverless dashboard. Choose Create workgroup.
Amazon Redshift is a fast, petabyte-scale, cloud datawarehouse that tens of thousands of customers rely on to power their analytics workloads. With its massively parallel processing (MPP) architecture and columnar data storage, Amazon Redshift delivers high price-performance for complex analytical queries against large datasets.
Amazon Redshift is a fast, fully managed, petabyte-scale datawarehouse that provides the flexibility to use provisioned or serverless compute for your analytical workloads. You don’t need to worry about workloads such as ETL (extract, transform, and load), dashboards, ad-hoc queries, and so on interfering with each other.
Download the 2021 DataOps Vendor Landscape here. This is not surprising given that DataOps enables enterprise data teams to generate significant business value from their data. QuerySurge – Continuously detect data issues in your delivery pipelines. DataOps is a hot topic in 2021. Production Monitoring Only.
Create a Customized Dashboard – Earn Love, Drive Change. #2. Leverage Custom Alerts – Let Data Kick Your Butt Into Action. #3. Create a Customized Dashboard – Earn Love, Drive Change! Who does not love dashboards? Then click on Dashboards, and what do you see? New Dashboard. Humans love them.
Large-scale datawarehouse migration to the cloud is a complex and challenging endeavor that many organizations undertake to modernize their data infrastructure, enhance data management capabilities, and unlock new business opportunities. This makes sure the new data platform can meet current and future business goals.
AWS Glue has made this more straightforward with the launch of AWS Glue job observability metrics , which provide valuable insights into your data integration pipelines built on AWS Glue. With Grafana, you can create, explore, and share visually rich, data-driven dashboards. Download the Grafana template.
With Power BI, you can pull data from almost any data source and create dashboards that track the metrics you care about the most. You can drill into data, create a variety of visualizations, and (literally) ask questions about it using AI.
Do you have any dashboards? Do you have a data governance document? What data do you collect? Technical Questions Before Starting a Data Strategy. How and where is your current data stored? What is the current data infrastructure? Do you have a datawarehouse? Do you use any external data?
When we talk about business intelligence system, it normally includes the following components: datawarehouse BI software Users with appropriate analytical. Data analysis and processing can be carried out while ensuring the correctness of data. DataWarehouse. Data Analysis. Free Download.
In today’s dynamic business environment, gaining comprehensive visibility into financial data is crucial for making informed decisions. This is where the significance of a financial dashboard shines through. What is A Financial Dashboard? You can download FineReport for free and have a try!
Definition: BI vs Data Science vs Data Analytics. Business Intelligence describes the process of using modern datawarehouse technology, data analysis and processing technology, data mining, and data display technology for visualizing, analyzing data, and delivering insightful information.
During that same time, AWS has been focused on helping customers manage their ever-growing volumes of data with tools like Amazon Redshift , the first fully managed, petabyte-scale cloud datawarehouse. One group performed extract, transform, and load (ETL) operations to take raw data and make it available for analysis.
With the advent of Business Intelligence Dashboard (BI Dashboard), access to information is no longer limited to IT departments. Every user can now create interactive reports and utilize data visualization to disseminate knowledge to both internal and external stakeholders.
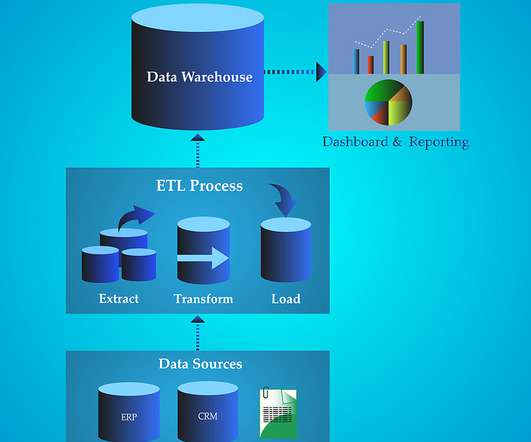
This process of extracting , transforming , and loading data into a central repository is commonly known as “ETL.” ” It’s one of the fundamental building blocks of a datawarehouse, and for companies that wish to provide robust, flexible, and comprehensive reporting, ETL is invaluable.
Company data exists in the data lake. Data Catalog profilers have been run on existing databases in the Data Lake. A Cloudera DataWarehouse virtual warehouse with Cloudera Data Visualisation enabled exists. A Cloudera Data Engineering service exists. The Data Scientist.
It automatically provisions and intelligently scales datawarehouse compute capacity to deliver fast performance, and you pay only for what you use. Just load your data and start querying right away in the Amazon Redshift Query Editor or in your favorite business intelligence (BI) tool. How to monitor queries based on status?
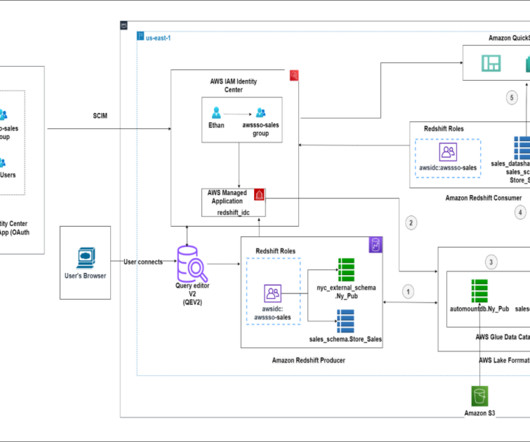
This integration simplifies the authentication and authorization process for Amazon Redshift users using Query Editor V2 or Amazon Quicksight , making it easier for them to securely access your datawarehouse. Note: Your organization’s IdC instance must be in the same region as the Amazon Redshift datawarehouse you’re connecting to.
It is composed of three functional parts: the underlying data, data analysis, and data presentation. The underlying data is in charge of data management, covering data collection, ETL, building a datawarehouse, etc. You can download it for a free trial. You might also be interested in….
For more sophisticated multidimensional reporting functions, however, a more advanced approach to staging data is required. The DataWarehouse Approach. Datawarehouses gained momentum back in the early 1990s as companies dealing with growing volumes of data were seeking ways to make analytics faster and more accessible.
Data Consolidation. A datawarehouse can help you collect business data from multiple sources and use it for accurate reporting and analytics. BI powered by datawarehouses can better correlate data from disparate systems and provide greater insight into the supply chain, sales, financials, etc.
Redshift Serverless is a serverless option of Amazon Redshift that allows you to run and scale analytics without having to provision and manage datawarehouse clusters. Redshift Serverless automatically provisions and intelligently scales datawarehouse capacity to deliver high performance for all your analytics.
Data lakes are more focused around storing and maintaining all the data in an organization in one place. And unlike datawarehouses, which are primarily analytical stores, a data hub is a combination of all types of repositories—analytical, transactional, operational, reference, and data I/O services, along with governance processes.
It allows you to extract data and present data in the form of charts, tables, reports, and dashboards to transform the data into useful information. . The presentation tier of the reporting platform usually plays a role in displaying the reports and dashboards. You can download it for a free trial.
While cloud-native, point-solution datawarehouse services may serve your immediate business needs, there are dangers to the corporation as a whole when you do your own IT this way. Cloudera DataWarehouse (CDW) is here to save the day! CDW is an integrated datawarehouse service within Cloudera Data Platform (CDP).
Which problems do disparate data points speak to? And how can the data collected across multiple touchpoints, from retail locations to the supply chain to the factory be easily integrated? Enter data warehousing. So how is the data extracted? Get Insight Now.
Determine the source of the data . Which database are the data from? Enterprise datawarehouse? What database tables are the data from? There are three types of reports that allow you to design reports of various functional styles to meet the needs of various data analysis scenarios. ERP database?
Having a data dictionary means any potential user will be able to understand the data in a datawarehouse. By defining the metadata that is created by the data stored in the system, you can isolate relevant information and identify which variables impact the results of the data. Download Now.
Once you have your data governance and MDM plan in order, you need to execute it through centralized data storage that allows you to migrate data and integrate it from multiple sources. Get a better understanding of what you need to do to improve your data quality and prepare your data for accurate insight.
Technicals such as datawarehouse, online analytical processing (OLAP) tools, and data mining are often binding. On the opposite, it is more of a comprehensive application of datawarehouse, OLAP, data mining, and so forth. Each report utilizes data visualization elements such as histograms or pie charts.
According to the process from data to knowledge, the functional architecture of a general enterprise reporting system is shown below:It is divided into three functional levels: the underlying data, data analysis, and data presentation. Dashboard Mode is for making a multi-perspective analysis. From FineReport.
This recognition is a testament to our vision and ability as a strategic partner to deliver an open and interoperable Cloud data platform, with the flexibility to use the best fit data services and low code, no code Generative AI infused practitioner tools.
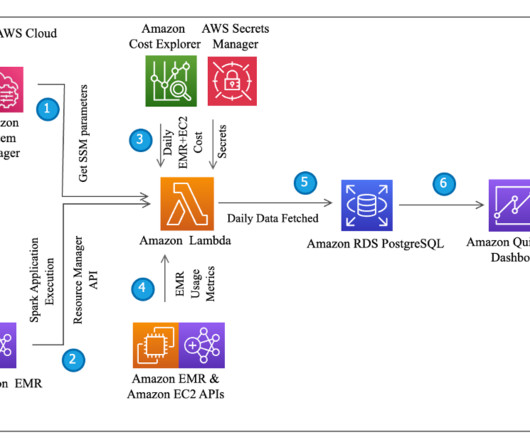
You can use the AWS Cloud Development Kit (AWS CDK) to deploy the Lambda function, RDS for PostgreSQL data model tables, and a QuickSight dashboard to track EMR cluster cost at the job, team, or business unit level. The following schema show the tables used in the solution which are queried by QuickSight to populate the dashboard.
Apache Spark enables you to build applications in a variety of languages, such as Java, Scala, and Python, by accessing the data in your Amazon Redshift datawarehouse. Amazon Redshift integration for Apache Spark helps developers seamlessly build and run Apache Spark applications on Amazon Redshift data.
Which problems do disparate data points speak to? And how can the data collected across multiple touchpoints, from retail locations to the supply chain to the factory be easily integrated? Enter data warehousing. So how is the data extracted? Download this white paper! Download Now. And we can help!
Dashboards and visualizations are the primary user interfaces of many tools and platforms. Enterprise BI typically functions by combining enterprise datawarehouse and enterprise license to a BI platform or toolset that business users in various roles can use. Enterprise BI dashboard by FineReport. Free Download.
You might be modernizing your data architecture using Amazon Redshift to enable access to your data lake and data in your datawarehouse, and are looking for a centralized and scalable way to define and manage the data access based on IdP identities. Download the.yml file or launch the CloudFormation stack.
We organize all of the trending information in your field so you don't have to. Join 42,000+ users and stay up to date on the latest articles your peers are reading.
You know about us, now we want to get to know you!
Let's personalize your content
Let's get even more personalized
We recognize your account from another site in our network, please click 'Send Email' below to continue with verifying your account and setting a password.


Let's personalize your content