This site uses cookies to improve your experience. To help us insure we adhere to various privacy regulations, please select your country/region of residence. If you do not select a country, we will assume you are from the United States. Select your Cookie Settings or view our Privacy Policy and Terms of Use.
Cookie Settings
Cookies and similar technologies are used on this website for proper function of the website, for tracking performance analytics and for marketing purposes. We and some of our third-party providers may use cookie data for various purposes. Please review the cookie settings below and choose your preference.
Used for the proper function of the website
Used for monitoring website traffic and interactions
Cookie Settings
Cookies and similar technologies are used on this website for proper function of the website, for tracking performance analytics and for marketing purposes. We and some of our third-party providers may use cookie data for various purposes. Please review the cookie settings below and choose your preference.
Strictly Necessary: Used for the proper function of the website
Performance/Analytics: Used for monitoring website traffic and interactions
Gathering data and information from one or multiple platforms and creating a comprehensive social media dashboard is equally important as creating the social content itself. Your Chance: Want to test a social media dashboard software for free? Benefit from professional social dashboards! What Is A Social Media Dashboard?
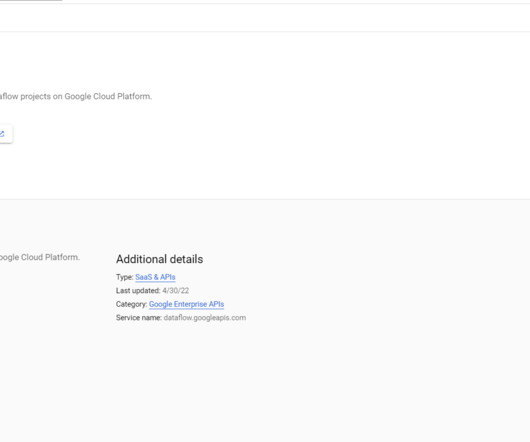
Introduction Companies can access a large pool of data in the modern business environment, and using this data in real-time may produce insightful results that can spur corporate success. Real-time dashboards such as GCP provide strong datavisualization and actionable information for decision-makers.
Business intelligence concepts refer to the usage of digital computing technologies in the form of datawarehouses, analytics and visualization with the aim of identifying and analyzing essential business-based data to generate new, actionable corporate insights. They enable powerful datavisualization.
BI architecture has emerged to meet those requirements, with data warehousing as the backbone of these processes. One of the BI architecture components is data warehousing. Each of that component has its own purpose that we will discuss in more detail while concentrating on data warehousing. Data integration.
Domo is best known as a business intelligence (BI) and analytics software provider, thanks to its functionality for visualization, reporting, data science and embedded analytics. Domo made several significant announcements at its recent Domopalooza customer event in Salt Lake City.
In todays data-driven world, securely accessing, visualizing, and analyzing data is essential for making informed business decisions. For instance, a global sports gear company selling products across multiple regions needs to visualize its sales data, which includes country-level details.
Amazon Redshift , launched in 2013, has undergone significant evolution since its inception, allowing customers to expand the horizons of data warehousing and SQL analytics. Industry-leading price-performance Amazon Redshift offers up to three times better price-performance than alternative cloud datawarehouses.
However, computerization in the digital age creates massive volumes of data, which has resulted in the formation of several industries, all of which rely on data and its ever-increasing relevance. Data analytics and visualization help with many such use cases. It is the time of big data. Select a Storage Platform.
Adding to these innovations, we most recently released CDP DataVisualization (DV) — A native visualization tool built from our acquisition of Arcadia Data that augments data exploration and analytics across the lifecycle to more effectively share insights across the business.
Ad hoc reporting, also known as one-time ad hoc reports, helps its users to answer critical business questions immediately by creating an autonomous report, without the need to wait for standard analysis with the help of real-time data and dynamic dashboards. Easy to use: .
Amazon Redshift is a fast, scalable, secure, and fully managed cloud datawarehouse that lets you analyze your data at scale. Amazon Redshift Serverless lets you access and analyze data without the usual configurations of a provisioned datawarehouse. Choose a query to view it in Query profiler.
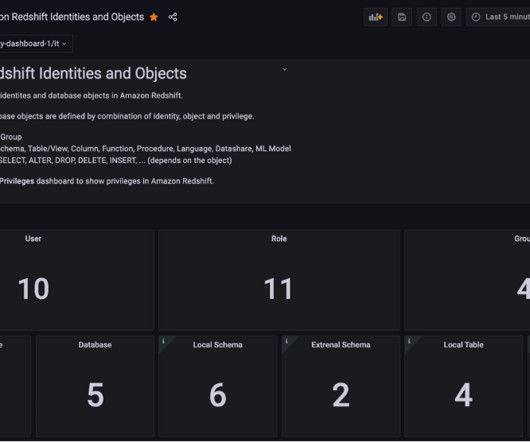
Amazon Redshift is a fully managed, petabyte-scale datawarehouse service in the cloud. Amazon Redshift enables you to use SQL for analyzing structured and semi-structured data with best price performance along with secure access to the data. Grafana provides a predefined dashboard to visualize database privileges.
Unified access to your data is provided by Amazon SageMaker Lakehouse , a unified, open, and secure data lakehouse built on Apache Iceberg open standards. The final model provides sales teams with the highest-value opportunities, which they can visualize in a business intelligence dashboard and take action on immediately.
a) Data Connectors Features. c) Dashboard Features. For a few years now, Business Intelligence (BI) has helped companies to collect, analyze, monitor, and present their data in an efficient way to extract actionable insights that will ensure sustainable growth. c) Join Data Sources. Table of Contents. Let’s get started!
In the following section, two use cases demonstrate how the data mesh is established with Amazon DataZone to better facilitate machine learning for an IoT-based digital twin and BI dashboards and reporting using Tableau. This is further integrated into Tableau dashboards. This led to a complex and slow computations.
In a world increasingly dominated by data, users of all kinds are gathering, managing, visualizing, and analyzing data in a wide variety of ways. One of the downsides of the role that data now plays in the modern business world is that users can be overloaded with jargon and tech-speak, which can be overwhelming.
Dashboard reporting refers to putting the relevant business metrics and KPIs in one interface, presenting them visually, dynamic, and in real-time, in the dashboard formats. This article will review the best 10 dashboard tools covering different areas, including open source and free software. What Makes a Great Dashboard?
Grafana provides powerful customizable dashboards to view pipeline health. QuickSight makes it straightforward for business users to visualizedata in interactive dashboards and reports. QuickSight makes it straightforward for business users to visualizedata in interactive dashboards and reports.
Amazon Redshift is a fully managed, petabyte-scale datawarehouse service in the cloud that delivers powerful and secure insights on all your data with the best price-performance. With Amazon Redshift, you can analyze your data to derive holistic insights about your business and your customers.
If nothing can be changed, there is no point of analyzing data. But if you find a development opportunity, and see that your business performance can be significantly improved, then a KPI dashboard software could be a smart investment to monitor your key performance indicators and provide a transparent overview of your company’s data.
Business leaders, developers, data heads, and tech enthusiasts – it’s time to make some room on your business intelligence bookshelf because once again, datapine has new books for you to add. We have already given you our top datavisualization books , top business intelligence books , and best data analytics books.
BI analysts, with an average salary of $71,493 according to PayScale , provide application analysis and data modeling design for centralized datawarehouses and extract data from databases and datawarehouses for reporting, among other tasks. BI encompasses numerous roles. Organization: Microsoft.
Amazon Redshift Serverless makes it simple to run and scale analytics without having to manage your datawarehouse infrastructure. In Cost Explorer, you can visualize daily, monthly, and forecasted spend by combining an array of available filters. Michael Yitayew is a Product Manager for Amazon Redshift based out of New York.
To simplify things, you can think of back-end BI skills as more technical in nature and related to building BI platforms, like online datavisualization tools. Front-end analytical and business intelligence skills are geared more towards presenting and communicating data to others. b) If You’re Already In The Workforce.
In addition to increasing the price of deployment, setting up these datawarehouses and processors also impacted expensive IT labor resources. Check out this investor relations dashboard example below, part of our management dashboard series: **click to enlarge**. They also need these tools to generate a true ROI.
Amazon Redshift is the most widely used datawarehouse in the cloud, best suited for analyzing exabytes of data and running complex analytical queries. Amazon QuickSight is a fast business analytics service to build visualizations, perform ad hoc analysis, and quickly get business insights from your data.
In this post, we highlight the seamless integration of Amazon Athena and Amazon QuickSight , which enables the visualization of operational metrics for AWS Glue Data Quality rule evaluation in an efficient and effective manner. The crawler builds a Data Catalog, so the data can be queried using Athena.
In our previous blog post we introduced Cloudera DataVisualization in Cloudera DataWarehouse (CDW) available in tech preview, in CDP Public Cloud. This blog will help you get started with Cloudera DataVisualization, so you can start building interesting and powerful applications on all types of data.
Specific business intelligence technologies may include: ad hoc analysis Data querying & discovery Datawarehouse Enterprise reporting DatavisualizationDashboards. Also, I will give you some samples on dashboards, ad-hoc analysis, enterprise reporting to help to understand. Datawarehouse.
BI tools access and analyze data sets and present analytical findings in reports, summaries, dashboards, graphs, charts, and maps to provide users with detailed intelligence about the state of the business. Business intelligence examples Reporting is a central facet of BI and the dashboard is perhaps the archetypical BI tool.
This should also include creating a plan for data storage services. Are the data sources going to remain disparate? Or does building a datawarehouse make sense for your organization? Rely on interactive datavisualizations. For decades now, data analytics has been considered a segregated task.
A DSS leverages a combination of raw data, documents, personal knowledge, and/or business models to help users make decisions. The data sources used by a DSS could include relational data sources, cubes, datawarehouses, electronic health records (EHRs), revenue projections, sales projections, and more.
We realized we needed a datawarehouse to cater to all of these consumer requirements, so we evaluated Amazon Redshift. At the same time, we had to find a way to implement entitlements in our Amazon Redshift datawarehouse with the same set of tags that we had already defined in Lake Formation.
Central to Byrdak’s multi-year transformation plan is the expansion of MealConnect, the first nationally available food rescue and sourcing platform, and a new datawarehouse to anchor an analytics offering that helps food banks analyze and visualize their food sourcing and distribution data.
Power BI is Microsoft’s interactive datavisualization and analytics tool for business intelligence (BI). With Power BI, you can pull data from almost any data source and create dashboards that track the metrics you care about the most. What-if parameters also create calculated measures you can reference elsewhere.
Data scientists derive insights from data while business analysts work closely with and tend to the data needs of business units. Business analysts sometimes perform data science, but usually, they integrate and visualizedata and create reports and dashboards from data supplied by other groups.
HR&A has used Amazon Redshift Serverless and CARTO to process survey findings more efficiently and create custom interactive dashboards to facilitate understanding of the results. This frees up our local computer space, greatly automates the survey cleaning and analysis step, and allows our clients to easily access the data results.
In a modern data architecture, unified analytics enable you to access the data you need, whether it’s stored in a data lake or a datawarehouse. One of the most common use cases for data preparation on Amazon Redshift is to ingest and transform data from different data stores into an Amazon Redshift datawarehouse.
AWS Glue has made this more straightforward with the launch of AWS Glue job observability metrics , which provide valuable insights into your data integration pipelines built on AWS Glue. With Grafana, you can create, explore, and share visually rich, data-driven dashboards. Lastly, configure the dashboard.
DataOps needs a directed graph-based workflow that contains all the data access, integration, model and visualization steps in the data analytic production process. It orchestrates complex pipelines, toolchains, and tests across teams, locations, and data centers. Meta-Orchestration . Production Monitoring Only.
Analytics and data are becoming an integral part of every software product and every company. Activate Your Dashboard. 5 Advantages of Using a Redshift DataWarehouse. Whatever business you’re in, your company is becoming a data company. That means you need to put all that data somewhere. Sisense BloX 2.0:
In-WarehouseData Prep provides builders with the advanced functionality they need to rapidly transform and optimize raw data creating materialized views on cloud datawarehouses. In-WarehouseData Prep supports both AWS Redshift and Snowflake datawarehouses. Additional capabilities.
With quality data at their disposal, organizations can form datawarehouses for the purposes of examining trends and establishing future-facing strategies. Industry-wide, the positive ROI on quality data is well understood. Business/Data Analyst: The business analyst is all about the “meat and potatoes” of the business.
In his classic work, the Visual Display of Quantitative Information , Edward R. Tufte powerfully illustrates the impact that datavisualization can have on real-world decisions. He provides a second example in which the absence of datavisualization leads to the opposite outcome.
We organize all of the trending information in your field so you don't have to. Join 42,000+ users and stay up to date on the latest articles your peers are reading.
You know about us, now we want to get to know you!
Let's personalize your content
Let's get even more personalized
We recognize your account from another site in our network, please click 'Send Email' below to continue with verifying your account and setting a password.


Let's personalize your content