Remove Dashboards Remove Definition Remove Statistics
article thumbnail

Your Definitive Guide To Building Valuable Narratives Through Data Storytelling

datapine

Stories inspire, engage, and have the unique ability to transform statistical information into a compelling narrative that can significantly enhance business success. Exclusive Bonus Content: Your definitive guide to data storytelling! Exclusive Bonus Content: Your definitive guide to data storytelling!

KPI 193
article thumbnail

Business Intelligence and Analytics: Definitive Guide

FineReport

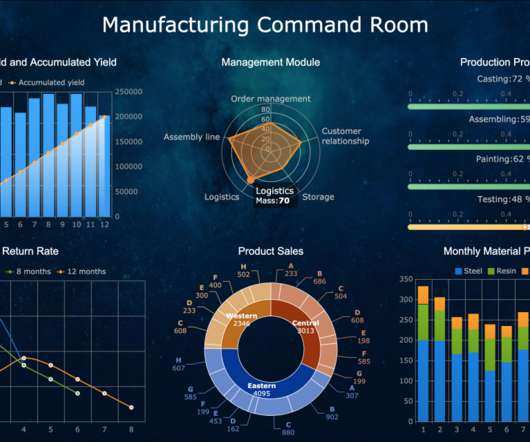
This article will discuss the definition of business intelligence and analytics and the difference between them. Definition. According to the definition, business intelligence and analytics refer to the data management solutions implemented in companies to collect, analyze and drive insights from data. Dashboard(by FineReport).

Insiders

Sign Up for our Newsletter

This site is protected by reCAPTCHA and the Google Privacy Policy and Terms of Service apply.

article thumbnail

A Guide To Performing Successful Content Reporting Using Modern Dashboards

datapine

2) What Is A Content Dashboard? 4) Content Dashboards Examples. Modern content performance reports in the shape of an interactive online dashboard present an intuitive and accessible way to assess your content’s success and its ROI in real-time and in one centralized location. What Is A Content Dashboard?

article thumbnail

Take Advantage Of Professional CTO Dashboards & Reports

datapine

To successfully gain control and improve a company’s technological needs, CTO dashboards and reports are needed as invaluable tools that consolidate multiple data points and support chief officers in strategic developments as well as online data analysis efforts, empowering their status of champions for new solutions.

article thumbnail

Your Definitive Guide To Modern & Professional Procurement Reports

datapine

Fortunately, we live in a digital age rife with statistics, data, and insights that give us the power to spot potential issues and inefficiencies within the business. With the help of a dashboard designer , you can simply drag-and-drop your values and create interactive visualizations that will point out errors immediately.

Reporting 158
article thumbnail

Mastering Data Analysis Report and Dashboard

FineReport

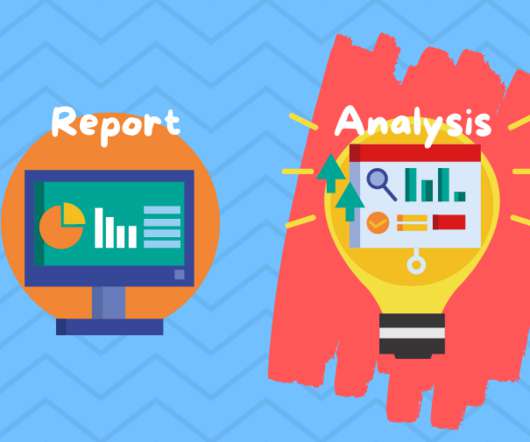
As we explore examples of data analysis reports and interactive report data analysis dashboards, we embark on a journey to unravel the nuanced art of transforming raw data into meaningful narratives that empower decision-makers. These reports distill viewpoints for guiding operations based on statistics, hotspots, and audience analysis.

article thumbnail

Business Intelligence and Analytics: Definitive Guide

FineReport

This article will discuss the definition of business intelligence and analytics and the difference between them. Definition. According to the definition, business intelligence and analytics refer to the data management solutions implemented in companies to collect, analyze and drive insights from data. Dashboard(by FineReport).