This site uses cookies to improve your experience. To help us insure we adhere to various privacy regulations, please select your country/region of residence. If you do not select a country, we will assume you are from the United States. Select your Cookie Settings or view our Privacy Policy and Terms of Use.
Cookie Settings
Cookies and similar technologies are used on this website for proper function of the website, for tracking performance analytics and for marketing purposes. We and some of our third-party providers may use cookie data for various purposes. Please review the cookie settings below and choose your preference.
Used for the proper function of the website
Used for monitoring website traffic and interactions
Cookie Settings
Cookies and similar technologies are used on this website for proper function of the website, for tracking performance analytics and for marketing purposes. We and some of our third-party providers may use cookie data for various purposes. Please review the cookie settings below and choose your preference.
Strictly Necessary: Used for the proper function of the website
Performance/Analytics: Used for monitoring website traffic and interactions
Organizations that continued full speed ahead with their digitaltransformation initiatives during the COVID-19 pandemic are able to ruminate on what went right and what they would have done differently, with the benefit of hindsight. But there are lesser-known, less obvious attributes of a successful digital program.
Despite the best of intentions, CIOs and their organizations often struggle to deliver business outcomes from digitaltransformation strategies. And while KPMG reports that 72% of CEOs have aggressive digital investment strategies, McKinsey details a harsh reality that 70% of transformations fail.
Here, CIO Patrick Piccininno provides a roadmap of his journey from data with no integration to meaningful dashboards, insights, and a data literate culture. For the first time, we’re consolidating data to create real-time dashboards for revenue forecasting, resource optimization, and labor utilization. What’s driving this investment?
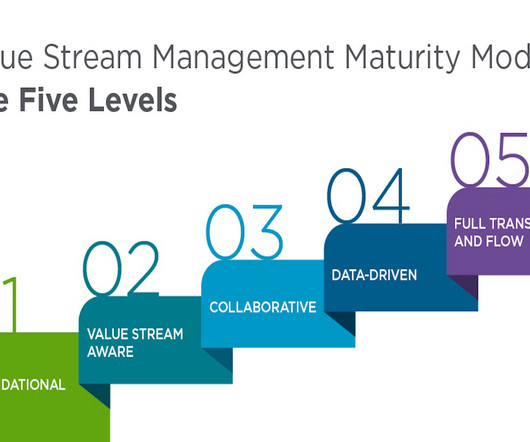
New research 1 underscores the common challenges many enterprises face in advancing their Value Stream Management (VSM) maturity levels for digitaltransformation, emphasizing the crucial need for effective guidance. Many at this level have embarked on digitaltransformation initiatives to improve efficiency and agility.
For CIOs leading enterprise transformations, portfolio health isnt just an operational indicator its a real-time pulse on time-to-market and resilience in a digital-first economy. Understanding and tracking the right software delivery metrics is essential to inform strategic decisions that drive continuous improvement.
Mobile technology has changed the way we interact with the world around us, and when it comes to analyzing valuable business insights, mobile dashboards offer the freedom and flexibility to turn stats into success while you’re on the go. What Is A Mobile Dashboard? Why Are Mobile Dashboards Important?
Digitaltransformation has the power to radically overhaul every aspect of an organization’s operations. But because of the company-wide impact of a financial transformation, the office of the CFO plays a unique role in driving the transformation beyond its own territory. Naturally, that includes the finance department.
Regardless of where organizations are in their digitaltransformation, CIOs must provide their board of directors, executive committees, and employees definitions of successful outcomes and measurable key performance indicators (KPIs). As a result, outcome-based metrics should be your guide.
In the following section, two use cases demonstrate how the data mesh is established with Amazon DataZone to better facilitate machine learning for an IoT-based digital twin and BI dashboards and reporting using Tableau. This is further integrated into Tableau dashboards. This led to a complex and slow computations.
It’s important for business users to be able to see quality scores and metrics to make confident business decisions and debug data quality issues. It provides insights and metrics related to the performance and effectiveness of data quality processes. We can analyze the data quality score and metrics using Athena SQL queries.
As digitaltransformation evolves, and more businesses begin to harness the power of digital technologies, the rate at which we are creating data is rising by the second. Usually the process is done through a BI dashboard software that helps users directly interact with the data and generate insights instantaneously.
Over the past decade, CIOs have invested significantly in digitaltransformation initiatives in an effort to improve customer experiences, build data analytics capabilities, and deliver productivity enhancements with automation. Unfortunately, the business impact of many digitaltransformations continues to fall short of expectations.
Pre-defined metrics and KPIs: Vertical SaaS is already integrated with pre-defined metrics, KPIs , and analytics that businesses can utilize to assess and address daily and long-term processes and performance. The revolution is here, and it’s digital. We are in the age of digitaltransformation.
As a result, your relationship to many important financial metrics changes. This understanding of the “human in the loop” suggests a user interface that’s more like a dashboard than a web form. The second needs to feed back into the metrics and dashboards for monitoring the system’s behavior. Is retraining needed?
In this post, we show how to ingest CSV files from Amazon Simple Storage Service (Amazon S3) into Amazon OpenSearch Service using the Amazon OpenSearch Ingestion feature and visualize the ingested data using OpenSearch Dashboards. Additionally, we demonstrate how to visualize the ingested data using OpenSearch Dashboards.
Developers, data architects and data engineers can initiate change at the grassroots level from integrating sustainability metrics into data models to ensuring ESG data integrity and fostering collaboration with sustainability teams. However, embedding ESG into an enterprise data strategy doesnt have to start as a C-suite directive.
Enterprise transformation demands technology to work and people to adopt it. The “people” component of enterprise transformation can make or break digitaltransformation. Having an executive leadership team that is committed to the transformation at the outset is critical to transformation success.
To gain employee buy-in, Stout’s team builds BI dashboards to show them how they can easily connect to and interact with their data, as well as visualize it in a meaningful way. I can build a dashboard and show them the intelligence that either proves that what they think is correct, or I can prove them wrong and show them why.”
Develop holistic metrics aligned with business objectives, integrating KPIs and OKRs into automated systems. Implement real-time dashboards to track performance across the organization. He also helps organizations thrive with AI, data excellence, and strategic architecture in today’s digital landscape.
Unless you take the necessary precautions, you run the risk of having to deal with multiple non-common data entries that may make your stats, facts, figures, and metrics inconsistent. With concrete data monitoring principles, you are well prepared to get all your key metrics out of your data with a smart KPI software like datapine.
Eight years ago, McGlennon hosted an off-site think tank with his staff and came up with a “technology manifesto document” that defined in those early days the importance of exploiting cloud-based services, becoming more agile, and instituting cultural changes to drive the company’s digitaltransformation.
To best quantify employee performance and ensure timely and accurate data, the performance dashboard makes its debut. What is Performance Dashboard. In addition, a performance dashboard allows companies to track all aspects of their daily activities. Types of Performance Dashboard. Financial performance dashboard.
At Atlanta’s Hartsfield-Jackson International Airport, an IT pilot has led to a wholesale data journey destined to transform operations at the world’s busiest airport, fueled by machine learning and generative AI.
Over the past decade, an ever-growing number of organisations have taken their infrastructure and applications to the cloud, delivering noticeable results impacting the bottom line and several other business metrics. Traditional approaches to availability and performance were often based on long-lived physical or virtualised infrastructures.
Digitaltransformation, in part accelerated by the COVID-19 pandemic, has driven rapid adoption of cloud-native technologies such as microservices and Kubernetes over the last two years. DigitalTransformation Traditional approaches to availability and performance were often based on physical infrastructure.
Some have managed to derive meaningful, rapid and repeatable business outcomes from their IoT data streams and analytics using Business Outcomes-as-a-Service (Atos BOaaS), developed by Atos , an international leader in digitaltransformation. Already, Atos customers have reported positive experiences.
As enterprises continue to plan, expand, or evolve their digitaltransformation efforts and shifts to the cloud, many are likely relying on IT consultants or considering hiring them for help. These tools can include project management software, shared dashboards, or task tracking spreadsheets,” Sonty says.
To transform Fujitsu from an IT company to a digitaltransformation (DX) company, and to become a world-leading DX partner, Fujitsu has declared a shift to data-driven management. The platform consists of approximately 370 dashboards, 360 tables registered in the data catalog, and 40 linked systems.
When faced with the challenge of improving data literacy and enabling digitaltransformation, the business would do well to consider the Embedded BI with integration APIs approach.’. But how does an organization encourage the use of data analytics and help business users to become more comfortable with the use of data?
The CLEA dashboards were built on the foundation of the Well-Architected Lab. For more information on this foundation, refer to A Detailed Overview of the Cost Intelligence Dashboard. These ingested datasets are used as a source in CLEA dashboards. This is done at the group level.
Sunil has over two decades of experience in building talent analytics capabilities and solutions, and most recently enabling organizations to drive their digitaltransformation journey. How do you track and report the impact of these metrics on key business outcomes? Hello Sunil, Welcome to our podcast.
One thing is clear for leaders aiming to drive trusted AI, resilient operations and informed decisions at scale: transformation starts with data you can trust. As a leader, your commitment to data quality sets the tone for the entire organization, inspiring others to prioritize this crucial aspect of digitaltransformation.
Those insights are provided to team captains during the BJK Cup finals via a dashboard on Microsoft Surface devices. Fine-tuning performance with in-match data The ITF worked closely with Microsoft and representatives from BJK Cup teams to develop the analytics and their presentation to ensure the dashboard would provide meaningful insights.
This might sound bafflingly obvious, but you’d be surprised how many times I’ve seen organizations skipping this step and going straight to building their KPI dashboards , without stopping for a second to think whether these KPIs are even relevant to the current project. The metrics need to fit the organization and not the other way around.
Ashwini: Hmm, see, BI systems of yesteryears provided good visibility on key metrics, but they were descriptive at best and had clear challenges as we started asking for more. Too many reports and metrics, but low clarity on what really needs attention. So, someone needs to go to a dashboard and identify any red flags.
SAP SCT’s features include pre-built data models containing metrics that can be customized or even created from scratch. Predefined dashboards in SAP Analytics Cloud including various analysis options open a wide range of possibilities for fact-based management based on the new key figures.
Companies with a modern data architecture and robust BI adoption not only gain immediate competitive advantage, they are positioned to move even further ahead by adopting real-time decisioning practices and predictive analytics, the next steps in digitaltransformation.
Eight years ago, McGlennon hosted an off-site think tank with his staff and came up with a “technology manifesto document” that defined in those early days the importance of exploiting cloud-based services, becoming more agile, and instituting cultural changes to drive the company’s digitaltransformation.
The PMO works with a project’s business sponsors to articulate expected outcomes, establish metrics for measuring success, and then report on the returns generated by the finished project. DigitalTransformation, IT Leadership, Project Management Tools
So employees in production could display 3D product models in their digital manufacturing dashboard and their work environment, thereby optimizing complex assembly processes. DigitalTransformation, Events, Manufacturing Industry, SAP, Supply Chain Management Software, Vendors and Providers
In Data-Powered Businesses , we dive into the ways that companies of all kinds are digitallytransforming to make smarter data-driven decisions, monetize their data, and create companies that will thrive in our current era of Big Data. Every company is becoming a data company. The way businesses operate is constantly evolving.
Organizations face increased pressure to move to the cloud in a world of real-time metrics, microservices and APIs, all of which benefit from the flexibility and scalability of cloud computing. An examination of cloud capabilities and maturity is a key component of this digitaltransformation and cloud adoption presents tremendous upside.
By tracking the metrics that matter, they can improve the supply chain and mitigate its risk. Digitaltransformation: The shift to virtual events. It can also empower your builders to create the apps and dashboards that will propel your company to its next phase of development.
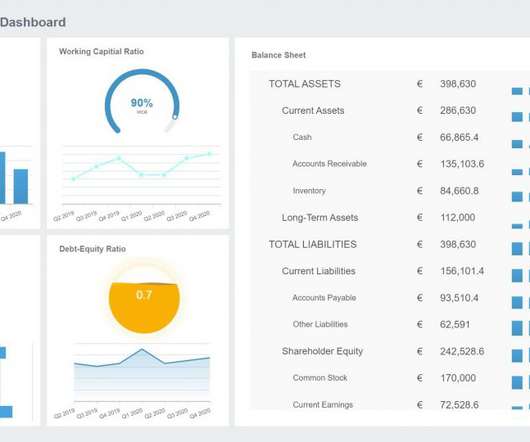
Key performance indicators of business performance are now available in easy-to-understand, graphical dashboards and reports.xc2xa0 Ultimately, data is knowledge and making this knowledge accessible to employees, partners, investors, and other stakeholders is beneficial to the business at large.
We organize all of the trending information in your field so you don't have to. Join 42,000+ users and stay up to date on the latest articles your peers are reading.
You know about us, now we want to get to know you!
Let's personalize your content
Let's get even more personalized
We recognize your account from another site in our network, please click 'Send Email' below to continue with verifying your account and setting a password.


Let's personalize your content