This site uses cookies to improve your experience. To help us insure we adhere to various privacy regulations, please select your country/region of residence. If you do not select a country, we will assume you are from the United States. Select your Cookie Settings or view our Privacy Policy and Terms of Use.
Cookie Settings
Cookies and similar technologies are used on this website for proper function of the website, for tracking performance analytics and for marketing purposes. We and some of our third-party providers may use cookie data for various purposes. Please review the cookie settings below and choose your preference.
Used for the proper function of the website
Used for monitoring website traffic and interactions
Cookie Settings
Cookies and similar technologies are used on this website for proper function of the website, for tracking performance analytics and for marketing purposes. We and some of our third-party providers may use cookie data for various purposes. Please review the cookie settings below and choose your preference.
Strictly Necessary: Used for the proper function of the website
Performance/Analytics: Used for monitoring website traffic and interactions
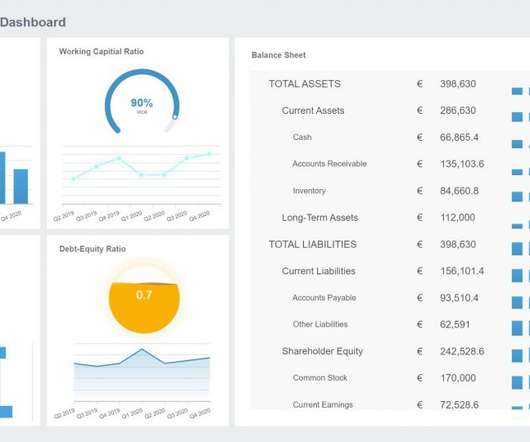
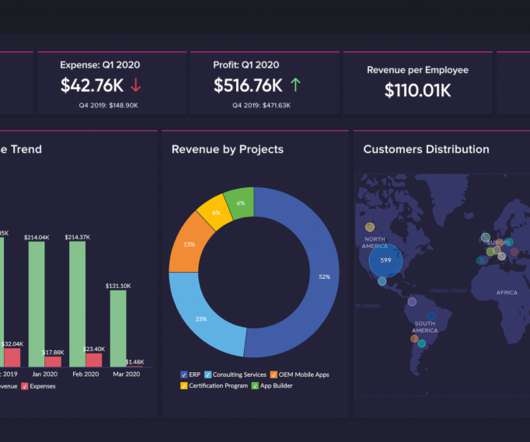
The rise of innovative, interactive, data-driven dashboard tools has made creating effective dashboards – like the one featured above – swift, simple, and accessible to today’s forward-thinking businesses. Dashboard design should be the cherry on top of your business intelligence (BI) project. Consider your end goal.
Exclusive Bonus Content: Reap the benefits of dashboards for CEOs! Download our short summary and become the best leader you can be! CEO dashboards and CEO reports are the answer. By leveraging the power of an online dashboard , an executive story can be written effortlessly, and within minutes. What Is A CEO Dashboard?
This is where the power of business dashboards comes into play. Dashboards often are the best way to gain insight into an organization and its various departments, operations and performance. Well-built, focused dashboards easily serve up summaries and reports of the BI that’s most critical to the organization.
By taking an online data visualization approach to handling your company’s strategic activities, big or small, you will make your business more cohesive, collaborative, intelligent and profitable – and project management dashboards will help you do just that. Download right here our free guide and get started with dashboards!
2) How To Measure Productivity? For years, businesses have experimented and narrowed down the most effective measurements for productivity. Today, employee output is no longer represented by vague descriptions, but by isolated figures that offer insight for improvement in specific areas, which can be found on an HR dashboard.
That said, if you’re looking to evolve your empire, increase brand awareness, and boost your bottom line, embracing business performance dashboards and big data should be at the top of your priority list. Download our pocket-sized summary and improve your operations! What Is A Performance Dashboard In Business?
By implementing the right reporting tools and understanding how to analyze as well as to measure your data accurately, you will be able to make the kind of data driven decisions that will drive your business forward. Download the list of the 11 essential steps to implement your BI strategy! Of course, this sounds incredible in theory.
By gaining the ability to gather, organize and analyze the metrics that are most important to your organization, you stand to make your business empire more intelligent than ever before – and executive reporting and business dashboards will help you do just that. Exclusive Bonus Content: Executive Dashboards & Reports: A Summary.
1) What Is A Small Business Dashboard? 3) Why Do You Need Small Business Dashboards. 4) Small Business Dashboard & KPIs Examples. Enter small business dashboards and metrics. BI dashboard tools provide smaller businesses with valuable insights regarding their operations thanks to real-time access to data.
An online BI dashboard. Thanks to specific business intelligence best practices for dashboard design. Exclusive Bonus Content: Download Our Free Dashboard Checklist! Get the free guide with great tips for your dashboard implementation! What Is The Definition Of A BI Dashboard? How can you create one?
In this post, we will explain what is a KPI scorecard, when to use it, what is the difference between scorecard and dashboard, and KPI scorecard examples and templates from business scenarios that can be applied to different departments and organizations or used as a roadmap for online data analysis. Let’s start with a simple definition.
I'm excited about the power of a well created dashboard. Dashboards are every where, we will look at a lot of them in this post and they are all digital. Here's a great dashboard, for the Museum of Art… take a minute to ponder it… Isn't it pretty awesome? And data pukes are not dashboards.
A data-driven finance report is also an effective means of remaining updated with any significant progress or changes in the status of your finances, and help you measure your financial results, cash flow, and financial position. Download our short executive guide to daily, weekly and monthly reports! b) Measure Revenue Loss.
Download here the top benefits cheat sheet, and start reporting! Each information can be gathered into a single, live dashboard , that will ultimately secure a fast, clear, simple, and effective workflow. Download here the top benefits cheat sheet, and start reporting! What Is BI Reporting? click to enlarge**.
In a hyper-connected digital world driven by data, there has never been a better time for businesses to gather meaningful insights on their target prospects, in addition to measuring ongoing levels of commercial growth and performance. Download our guide about the top 18 KPIs your social platforms need! Let’s get going.
6) The Use of Dashboards For Data Interpretation. Business dashboards are the digital age tools for big data. Through the art of streamlined visual communication, data dashboards permit businesses to engage in real-time and informed decision-making and are key instruments in data interpretation. 2) How To Interpret Data?
Mobile technology has changed the way we interact with the world around us, and when it comes to analyzing valuable business insights, mobile dashboards offer the freedom and flexibility to turn stats into success while you’re on the go. Download our bite-sized guide and unlock your fullest mobile potential!
Now here comes data dashboard ?Similar What is Data Dashboard?–Definition. A data dashboard is a useful tool that could display and analyze users’ complex data by means of data visualization so that the user gains a deep insight into the value of data. Data Dashboard Tool. Why Data Dashboard? Free Download.
Project dashboard, also known as project management dashboard, helps show the current project progress like a car dashboard and provide feedback to the team. What is a project dashboard? As mentioned above, project dashboard is similar to the car dashboard. reality use of dashboard . Free trial.
Marketing dashboard can do you a favor. What is a marketing dashboard? Marketing dashboard is a brief and detailed compilation of all relevant data about the company’s marketing activities, belonging to business intelligence for marketing. Use of Reports and Dashboard. How to choose an effective marketing dashboard?
As important parts of business intelligence, scorecard and dashboard can both play an obvious role in promoting enterprise development. However, limited by factors such as cost and corporate strategies, sometimes companies need to make a choice between scorecard vs dashboard. Definition of scorecard and dashboard. Free trial.
Among amounts of intelligent choices, business intelligence(BI) dashboard software is an awesome one. BI dashboard software definition. Business intelligence dashboard is a common module that general business intelligence has to realize data visualization. Sales analysis dashboard(by FineReport). FineReport. Advantages.
Management thinker Peter Drucker once stated, “if you can’t measure it, you can’t improve it” – and he couldn’t be more right. Download our short & sweet guide to daily, weekly and monthly reports. It shows how targets are performing in a monthly view, but the user can easily set this marketing dashboard to a yearly time frame.
Download our free executive summary and boost your sales strategy! Because after all – a business dashboard is worth a thousand Excel sheets. A sales graph example generated with a dashboard builder that will prove invaluable regardless of your niche or sector. Download our free executive summary and boost your sales strategy!
Download our game-changing summary and see your company grow! There is no doubt that today, self-service BI tools have well and truly taken root in many business areas with business analysts now in control of building their own reports and dashboards rather than waiting on IT to develop everything for them.”. Let’s get started!
Here, we’ll explore the unrivaled power of data storytelling in the digital age while looking at a mix of powerful data storytelling examples generated with a modern dashboard creator. Download our free executive summary and start creating your stories! Download our free executive summary and start creating your stories!
As important parts of business intelligence, scorecards and dashboards can both play an obvious role in promoting enterprise performance management. However, many users are confused with the difference between scorecard vs. dashboard. Definition of scorecard and dashboard. What is a dashboard? What is a scorecard?
You have metrics available per job run within the AWS Glue console, but they don’t cover all available AWS Glue job metrics, and the visuals aren’t as interactive compared to the QuickSight dashboard. In the following sections, we show you how to set up the solution, explore the dashboards, and configure alarms.
Our team at insightsoftware has created a free downloadable template illustrating what a best-in-class dashboard looks like. Spend some time exploring the dashboard to discover how easy it is to track free cash flow and how much decision making improves as a result. Where Do Dashboards Fit In?
Download our bite-sized guide and unlock your fullest analysis potential! Download our bite-sized guide and unlock your fullest analysis potential! For a look at the power of software for the purpose of data analysis and to enhance your methods of analyzing data, glance over our selection of dashboard examples.
Download our bite-sized guide and start with social reporting today! By using social media management reporting software to track, measure, and refine your socially-driven efforts, you will make better, swifter, and more informed decisions while maximizing your ROI with every initiative or interaction you make. Need we say more?
Download: A pocket-sized guide to invaluable financial graphs and charts. You can start by creating a simple income vs expenses graph, add additional charts relevant for your financial story and finally create a dashboard that will present all your data on a single screen. Which Role Financial Dashboards Play.
The purpose of a business dashboard is to help you make quick, calculated decisions based on raw data. Instead of combing through data from different applications and spreadsheets, a manager should be able to open up a dashboard and quickly get a visual status update on a specific project. Customization Options.
Download: A pocket-sized guide to operational and strategic reports! Operational reporting is an effective, results-driven means of tracking, measuring and analyzing a business’s regular deliverables and metrics, usually on a daily, weekly, and sometimes monthly basis with the help of modern and professional BI reporting tools.
This is where sales dashboards have proven to be highly effective. In sales, dashboards play a huge role in managing day-to-day operations, measuring performance, and adapting quickly to changing conditions. To set you up for success in analytics, we have created a quick guide on how to create the ultimate sales dashboard.
Dashboard monitoring tool can be your wonderful aid. What is dashboard monitoring tool? Dashboard monitoring tool enables enterprises to monitor digital marketing channels and business performance easily and effectively. All companies have to do to achieve this function is to combine data into a single, beautiful dashboard.
Download our guide to find out about the power of procurement reports! With the help of a dashboard designer , you can simply drag-and-drop your values and create interactive visualizations that will point out errors immediately. e) Take accurate measurements. Without further ado, let’s get started.
And dashboards are widely used to display business performance in enterprises. So how can we create a good dashboard, especially for beginners? The picture below shows the characteristics of the excellent dashboard that Stephen Few listed in the Dashboard Graphic Design Competition in 2012. Now, let’s get started!
I am going to break one of my unspoken cardinal rules: Only write about real problems and measurement that is actually possible in the real world. I am going to define a way for you to think about measuring social media, and you can't actually easily measure what I am going to recommend. So why not measure that?
In today’s business world, competition is fierce across all industries and sectors, which means that to survive and thrive, working with measurable online data analysis and performance metrics is essential. Download our overview and improve your helpdesk performance today! As the saying goes: what gets measured can be improved.
Modern dashboard software makes it simpler than ever to merge and visualize data in a way that’s as inspiring as it is accessible. But while doing so is easy, a great dashboard still requires a certain amount of strategic planning and design thinking. Download our list of different data visualization types you should know.
Product metrics are quantitative performance measurements used by businesses to gain insights into various areas like product development, pricing, quality, and more. They can evaluate architectural measures, quality measures, software complexity, or functional size. What Are Product Metrics?
What is Dashboard? What Is Dashboard?Actually, Dashboard ?from Visual presentation of performance measures Timesaving—Measure efficiencies or inefficiencies Command a fine view of all systems instantly Quick identification of data outliers and correlations Identify trends More informed decisions based on business intelligence.
Incremental Sales Calculation As mentioned, incremental sales are used by businesses as a key performance indicator to measure the financial success of their promotional efforts. To ensure you yield the results you desire, first establish your goals, then decide on the metrics that you will need to track to measure your performance.
We organize all of the trending information in your field so you don't have to. Join 42,000+ users and stay up to date on the latest articles your peers are reading.
You know about us, now we want to get to know you!
Let's personalize your content
Let's get even more personalized
We recognize your account from another site in our network, please click 'Send Email' below to continue with verifying your account and setting a password.


Let's personalize your content