This site uses cookies to improve your experience. To help us insure we adhere to various privacy regulations, please select your country/region of residence. If you do not select a country, we will assume you are from the United States. Select your Cookie Settings or view our Privacy Policy and Terms of Use.
Cookie Settings
Cookies and similar technologies are used on this website for proper function of the website, for tracking performance analytics and for marketing purposes. We and some of our third-party providers may use cookie data for various purposes. Please review the cookie settings below and choose your preference.
Used for the proper function of the website
Used for monitoring website traffic and interactions
Cookie Settings
Cookies and similar technologies are used on this website for proper function of the website, for tracking performance analytics and for marketing purposes. We and some of our third-party providers may use cookie data for various purposes. Please review the cookie settings below and choose your preference.
Strictly Necessary: Used for the proper function of the website
Performance/Analytics: Used for monitoring website traffic and interactions
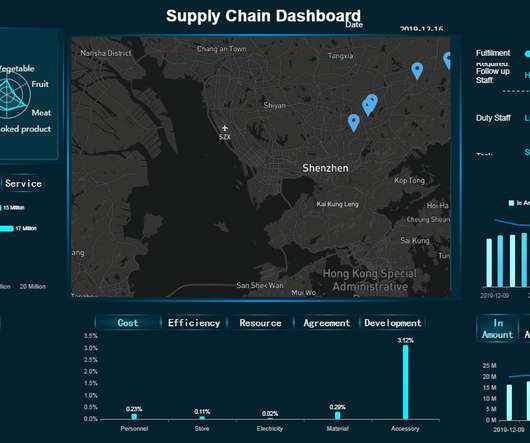
The rise of innovative, interactive, data-driven dashboard tools has made creating effective dashboards – like the one featured above – swift, simple, and accessible to today’s forward-thinking businesses. Dashboard design should be the cherry on top of your business intelligence (BI) project. Now, it’s time for the fun part.
This is where the power of business dashboards comes into play. Dashboards often are the best way to gain insight into an organization and its various departments, operations and performance. Well-built, focused dashboards easily serve up summaries and reports of the BI that’s most critical to the organization.
By taking an online data visualization approach to handling your company’s strategic activities, big or small, you will make your business more cohesive, collaborative, intelligent and profitable – and project management dashboards will help you do just that. Download right here our free guide and get started with dashboards!
Exclusive Bonus Content: Reap the benefits of dashboards for CEOs! Download our short summary and become the best leader you can be! CEO dashboards and CEO reports are the answer. By leveraging the power of an online dashboard , an executive story can be written effortlessly, and within minutes. What Is A CEO Dashboard?
Download to learn: 5 business benefits of automated data discovery with ABM. The evolution of dashboards to automated business monitoring. Why automation elevates - not replaces - your embedded dashboards How automated business monitoring separates insights from noise.
That said, if you’re looking to evolve your empire, increase brand awareness, and boost your bottom line, embracing business performance dashboards and big data should be at the top of your priority list. Download our pocket-sized summary and improve your operations! What Is A Performance Dashboard In Business?
Download our guide about the top 18 KPIs your social platforms need! These metrics are utilized by marketing teams to assess their efforts in all critical areas of social media-based performance, including engagement and advertising. It’s clear that social media metrics are particularly valuable to the modern brand and business.
1) What Are Productivity Metrics? 3) Productivity Metrics Examples. 4) The Value Of Workforce Productivity Metrics. Today, employee output is no longer represented by vague descriptions, but by isolated figures that offer insight for improvement in specific areas, which can be found on an HR dashboard. Table of Contents.
By gaining the ability to gather, organize and analyze the metrics that are most important to your organization, you stand to make your business empire more intelligent than ever before – and executive reporting and business dashboards will help you do just that. Exclusive Bonus Content: Executive Dashboards & Reports: A Summary.
A business intelligence dashboard coupled with a dynamic dashboard display will allow you to squeeze every last drop of value from the insights that matter most. But before we delve any deeper, let’s consider the definition of this kind of a dashboard and its role in the modern workplace. What Is A TV Dashboard?
We have IT-minded people engaging in massive data puking (one report with 30 metrics anyone?) I want to propose a framework you can use to measure success using metrics that matter for one simple reason: They actually measure if you are participating in the channel in an optimal fashion. That is why I love this metric.
1) What Is A Small Business Dashboard? 3) Why Do You Need Small Business Dashboards. 4) Small Business Dashboard & KPIs Examples. Enter small business dashboards and metrics. BI dashboard tools provide smaller businesses with valuable insights regarding their operations thanks to real-time access to data.
Purchasing analysis is usually represented as dashboards, reports, and data graphs, analyzing the company’s spending on suppliers by category or location. Purchase Reporting Dashboard(from FineReport). Free Download. Purchasing Center Dashboard. Purchasing Dashboard/Report & Key Metrics.
I'm excited about the power of a well created dashboard. Dashboards are every where, we will look at a lot of them in this post and they are all digital. Here's a great dashboard, for the Museum of Art… take a minute to ponder it… Isn't it pretty awesome? And data pukes are not dashboards.
But the problem is that single golden metrics hide valuable insights and, more often than not, drive bad behavior. Here's my proposal: If you are pushed to have a single golden metric, give it a partner. The BFF metric you find should not be one that is very far away. So, great metric. Honestly, who can blame them.
Approaches to communication are changing, and success in today’s technology-driven world correlates directly to the quantity rather than the quality of one’s information—metrics relating to the business, the client, the competitor, and the market. An online BI dashboard. Exclusive Bonus Content: Download Our Free Dashboard Checklist!
Download here the top benefits cheat sheet, and start reporting! Each information can be gathered into a single, live dashboard , that will ultimately secure a fast, clear, simple, and effective workflow. The balance sheet gives an overview of the main metrics which can easily define trends and the way company assets are being managed.
Download our short & sweet guide to daily, weekly and monthly reports. Structure your metrics. As with any report you might need to create, structuring and implementing metrics that will tell an interesting and educational data-story is crucial in our digital age. Let’s dig deeper. What Is A Marketing Report?
1) What Are Product Metrics? 2) Types Of Product Metrics. 3) Product Metrics Examples You Can Use. 4) Product Metrics Framework. The right product performance metrics will give you invaluable insights into its health, strength and weaknesses, potential issues or bottlenecks, and let you improve it greatly.
Download our short executive guide to daily, weekly and monthly reports! We live in a data-driven age, and the ability to use financial insights and metrics to your advantage will set you apart from the pack. Work Quality: These metrics help companies determine the quality level of their employees’ work performance.
In a world of infinite choice, the ability to pick critical few metrics to focus on is, well…, critical. In this post I want to share that one-page list of the best metrics for digital content, marketing and business success with you. Best Digital Metrics: Own Existences/Strategies. It would not surprise me.
While sometimes it’s okay to follow your instincts, the vast majority of your business-based decisions should be backed by metrics, facts, or figures related to your aims, goals, or initiatives that can ensure a stable backbone to your management reports and business operations. 3) Gather data now. 4) Find the unresolved questions.
In this post, we explore how to combine AWS Glue usage information and metrics with centralized reporting and visualization using QuickSight. You have metrics available per job run within the AWS Glue console, but they don’t cover all available AWS Glue job metrics, and the visuals aren’t as interactive compared to the QuickSight dashboard.
Mobile technology has changed the way we interact with the world around us, and when it comes to analyzing valuable business insights, mobile dashboards offer the freedom and flexibility to turn stats into success while you’re on the go. Download our bite-sized guide and unlock your fullest mobile potential!
An Operations Key Performance Indicator (KPI) or metric is a discrete measurement that a company uses to monitor and evaluate the efficiency of its day-to-day operations. Why Your Company Should Be Using Operational Metrics to Stay Competitive. This allows management to quickly make informed decisions that are backed up by data.
Tracking the success metrics based on your needs, and the time frame you select while comparing your values can be done with simple yet effective scorecards. Download right here our bite-sized guide and start creating your reports! Often it is called also a balanced scorecard dashboard since values can be presented on a dashboard.
Download: A pocket-sized guide to invaluable financial graphs and charts. Financial graphs and charts visually track liquidity, budgets, expenses, cash flow, and many other financial metrics while helping businesses avoid a monetary crisis by leveraging financial data in real-time, with a comprehensive overview of financial information.
Download our bite-sized guide and unlock your fullest analysis potential! Data analysis method focuses on strategic approaches to taking raw data, mining for insights that are relevant to the business’s primary goals, and drilling down into this information to transform metrics, facts, and figures into initiatives that benefit improvement.
Now here comes data dashboard ?Similar What is Data Dashboard?–Definition. A data dashboard is a useful tool that could display and analyze users’ complex data by means of data visualization so that the user gains a deep insight into the value of data. Data Dashboard Tool. Why Data Dashboard? Free Download.
Here, we’ll explore the unrivaled power of data storytelling in the digital age while looking at a mix of powerful data storytelling examples generated with a modern dashboard creator. Download our free executive summary and start creating your stories! Download our free executive summary and start creating your stories!
Download our free executive summary and boost your sales strategy! Because after all – a business dashboard is worth a thousand Excel sheets. A sales graph example generated with a dashboard builder that will prove invaluable regardless of your niche or sector. Download our free executive summary and boost your sales strategy!
Download: A pocket-sized guide to operational and strategic reports! Operational reporting is an effective, results-driven means of tracking, measuring and analyzing a business’s regular deliverables and metrics, usually on a daily, weekly, and sometimes monthly basis with the help of modern and professional BI reporting tools.
AWS Glue has made this more straightforward with the launch of AWS Glue job observability metrics , which provide valuable insights into your data integration pipelines built on AWS Glue. This post, walks through how to integrate AWS Glue job observability metrics with Grafana using Amazon Managed Grafana. Choose Save & test.
Among amounts of intelligent choices, business intelligence(BI) dashboard software is an awesome one. BI dashboard software definition. Business intelligence dashboard is a common module that general business intelligence has to realize data visualization. Sales analysis dashboard(by FineReport). FineReport.
Download our bite-sized guide and start with social reporting today! and metrics (follows, likes, reach, growth, awareness, post performance, engagements, etc.) Download our bite-sized guide and start with social reporting today! Choose the right metrics. Exclusive Bonus Content: Take Full Advantage of Social Platforms!
They have that designation because companies have discovered a direct correlation between the trajectory of these metrics and their own success or failure. The free cash flow metric focuses on one crucial aspect of finance that has an outsized impact on a company’s strategic agenda. Where Do Dashboards Fit In?
Download our free guide! Download our free guide! Created by storytelling expert Cole Nussbaumer Knaflic , this methodical handbook is not only entertaining, but it also provides deep-rooted insights into a branch of data science that is often overlooked: the art of storytelling through metrics. Download our free guide!
That’s why so many rely on accounts receivable dashboards to provide transparency and enable oversight. Accounts receivable dashboards offer a window into everything that matters with A/R. Users can quickly reference key metrics, see updated data in real time, and immediately understand the positives and negatives of performance.
But, while data offers us invaluable insight in more ways than one, with so much to analyze and such little time, it’s becoming increasingly difficult to understand which metrics offer real value. Download our executive, pocket-sized guide to real time BI and analytics! a) IT project management dashboard. click to enlarge**.
Dashboard reporting refers to putting the relevant business metrics and KPIs in one interface, presenting them visually, dynamic, and in real-time, in the dashboard formats. This article will review the best 10 dashboard tools covering different areas, including open source and free software. What Makes a Great Dashboard?
This is where sales dashboards have proven to be highly effective. In sales, dashboards play a huge role in managing day-to-day operations, measuring performance, and adapting quickly to changing conditions. To set you up for success in analytics, we have created a quick guide on how to create the ultimate sales dashboard.
In today’s business world, competition is fierce across all industries and sectors, which means that to survive and thrive, working with measurable online data analysis and performance metrics is essential. Working with service desk metrics and KPI reports will help you make the improvements you need for continual growth and success.
Amazon Redshift provides performance metrics and data so you can track the health and performance of your provisioned clusters, serverless workgroups, and databases. For Amazon Redshift provisioned, the Query profiler can be accessed by going to the provisioned clusters dashboard. Choose a query to view it in Query profiler.
When it comes to data analysis, you are usually more likely to see me share guidance on advanced segmentation or custom reports or advanced social metrics or controlled experiments or economic value or competitive intelligence or web analytics maturity or one of an infinite number of difficult, if hugely rewarding, things. New Dashboard.
We organize all of the trending information in your field so you don't have to. Join 42,000+ users and stay up to date on the latest articles your peers are reading.
You know about us, now we want to get to know you!
Let's personalize your content
Let's get even more personalized
We recognize your account from another site in our network, please click 'Send Email' below to continue with verifying your account and setting a password.


Let's personalize your content