This site uses cookies to improve your experience. To help us insure we adhere to various privacy regulations, please select your country/region of residence. If you do not select a country, we will assume you are from the United States. Select your Cookie Settings or view our Privacy Policy and Terms of Use.
Cookie Settings
Cookies and similar technologies are used on this website for proper function of the website, for tracking performance analytics and for marketing purposes. We and some of our third-party providers may use cookie data for various purposes. Please review the cookie settings below and choose your preference.
Used for the proper function of the website
Used for monitoring website traffic and interactions
Cookie Settings
Cookies and similar technologies are used on this website for proper function of the website, for tracking performance analytics and for marketing purposes. We and some of our third-party providers may use cookie data for various purposes. Please review the cookie settings below and choose your preference.
Strictly Necessary: Used for the proper function of the website
Performance/Analytics: Used for monitoring website traffic and interactions
Exclusive Bonus Content: Reap the benefits of dashboards for CEOs! Download our short summary and become the best leader you can be! CEO dashboards and CEO reports are the answer. By leveraging the power of an online dashboard , an executive story can be written effortlessly, and within minutes.
This is where the power of business dashboards comes into play. Dashboards often are the best way to gain insight into an organization and its various departments, operations and performance. Well-built, focused dashboards easily serve up summaries and reports of the BI that’s most critical to the organization.
An important part of a successful business strategy is utilizing a modern data analysis tool and implementing a marketing report in its core procedures that will become the beating heart of acquiring customers, researching the market, providing detailed data insights into the most valuable information for any business: is our performance on track?
Also, implementing effective management reports will create a data-driven approach to making business decisions and obtaining sustainable business success. Here, we explain the fundamental dynamics of project dashboard software, explore the benefits of project dashboards, and ask the question: what is a project dashboard?
Embedding dashboards, reports and analytics in your application presents unique opportunities and poses unique challenges. We interviewed 16 experts across business intelligence, UI/UX, security and more to find out what it takes to build an application with analytics at its core.
Big data plays a crucial role in online data analysis , business information, and intelligent reporting. That’s where business intelligence reporting comes into play – and, indeed, is proving pivotal in empowering organizations to collect data effectively and transform insight into action. What Is BI Reporting?
That said, if you’re looking to evolve your empire, increase brand awareness, and boost your bottom line, embracing business performance dashboards and big data should be at the top of your priority list. Download our pocket-sized summary and improve your operations! What Is A Performance Dashboard In Business?
As a business, you need the reliability of frequent financial reports to gain a better grasp of your financial status, both current and future. A robust finance report communicates crucial financial information that covers a specified period through daily, weekly, and monthly financial reports. What Is A Finance Report?
Using daily and/or weekly sales reports with your team may be the single most powerful action you can take to increase your team’s performance. And not just that, we will discuss the purpose and creation process so that you find out exactly what’s the story behind each report. What Is A Sales Report? Don’t believe us?
Before you add new dashboards and reports to your application, you need to evaluate your data architecture with analytics in mind. Download the whitepaper to see the 7 most common approaches to building a high-performance data architecture for embedded analytics. 9 questions to ask yourself when planning your ideal architecture.
Financial analysis and reporting are one of the bedrocks of modern business. While you may already know that financial reporting is important (mainly because it’s a legal requirement in most countries), you may not understand its untapped power and potential. Exclusive Bonus Content: Your cheat sheet on reporting in finance!
By gaining the ability to gather, organize and analyze the metrics that are most important to your organization, you stand to make your business empire more intelligent than ever before – and executive reporting and business dashboards will help you do just that. Exclusive Bonus Content: Executive Dashboards & Reports: A Summary.
To squeeze every last drop of value from your data, both in an operational and strategic sense, it’s important to leverage the right online reporting tool. When it comes to reporting, the daily running of your business, the plans and methods you formulate to improve the organization will steer your long-term success. Let’s begin.
Getting your socially-driven affairs in order can seem like an impossible feat, but with social media reporting, you will be able to gain the insights you need to attain the results you deserve. When you add up modern technology and a professional report tool , your reporting processes in the social realm will reap many rewards.
But today, dashboards and visualizations have become table stakes. Think your customers will pay more for data visualizations in your application? Five years ago they may have. Discover which features will differentiate your application and maximize the ROI of your embedded analytics. Brought to you by Logi Analytics.
A business intelligence dashboard coupled with a dynamic dashboard display will allow you to squeeze every last drop of value from the insights that matter most. But before we delve any deeper, let’s consider the definition of this kind of a dashboard and its role in the modern workplace. What Is A TV Dashboard?
By combining the art of storytelling with the technological capabilities of dashboard software , it’s possible to develop powerful, meaningful, data-backed presentations that not only move people but also inspire them to take action or make informed, data-driven decisions that will benefit your business. What Is Dashboard Storytelling?
The importance of procurement reports is becoming more and more prominent. Here, we introduce the definition and importance of purchase reports and provide templates and guidelines to inform you how to write an appropriate purchase report. What Is a Procurement Report? Purchasing Reports Samples. Free Download.
And procurement reporting is no exception to this. In this article, we will explain the basic definition of procurement reports, talk about the benefits and challenges that occur when dealing with procurement data to provide you with innovative ideas on spotting inefficiencies. What Are Procurement Reports?
An online BI dashboard. Thanks to specific business intelligence best practices for dashboard design. Exclusive Bonus Content: Download Our Free Dashboard Checklist! Get the free guide with great tips for your dashboard implementation! What Is The Definition Of A BI Dashboard? How can you create one?
Dashboardreporting refers to putting the relevant business metrics and KPIs in one interface, presenting them visually, dynamic, and in real-time, in the dashboard formats. This article will review the best 10 dashboard tools covering different areas, including open source and free software. What Makes a Great Dashboard?
I'm excited about the power of a well created dashboard. Dashboards are every where, we will look at a lot of them in this post and they are all digital. Here's a great dashboard, for the Museum of Art… take a minute to ponder it… Isn't it pretty awesome? And data pukes are not dashboards.
In fact, data has become the raw material that every business decision is based on while reporting tools create the environment to act on generated information swiftly and accurately. Download right here our bite-sized guide and start creating your reports! Scorecards vs Dashboards In Business – What Is The Difference?
Standard reports stink. Custom reports rock! Why would a report created for everyone work for the special someone that you are? Custom reports allow you to deeply focus (by eliminating the rif-raf metrics and dimensions, they save time and show just what you want). I've expressed it often. :). Seven more!
1) What Is A Small Business Dashboard? 3) Why Do You Need Small Business Dashboards. 4) Small Business Dashboard & KPIs Examples. Enter small business dashboards and metrics. BI dashboard tools provide smaller businesses with valuable insights regarding their operations thanks to real-time access to data.
Download our free executive summary and boost your sales strategy! Because after all – a business dashboard is worth a thousand Excel sheets. Let’s examine how you can do so with the following sales KPIs, created for a comprehensive sales report. Download our free executive summary and boost your sales strategy!
Mobile technology has changed the way we interact with the world around us, and when it comes to analyzing valuable business insights, mobile dashboards offer the freedom and flexibility to turn stats into success while you’re on the go. Download our bite-sized guide and unlock your fullest mobile potential!
Historically, the terms data report or business report haven’t got the crowds excited. Data reports have always been important for businesses. The business intelligence industry has been revolutionized over the past decade and data reports are in on the fun. Exclusive Bonus Content: Get our data reporting recommendations!
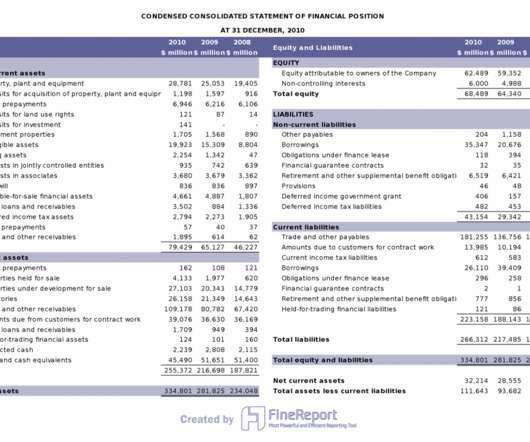
One of the most common channels for companies to provide financial performance transparency is accounting reports. This article starts with the accounting report’s definition and meaning and then lists the company’s three most important accounting reports. What are Accounting Reports? Free Download.
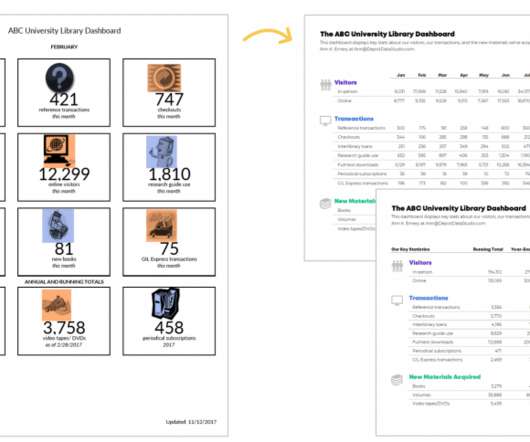
As part of that process, we redesigned several of their existing reports and dashboards. When asked to submit their existing visualizations to be redesigned, one of the conference attendees sent me this dashboard (shown below). I typically see “dashboards” that drone on for way too many pages. That’s a given, right?
At work, we often hear others talking about reports. But what does reporting mean exactly? There are multiple types of reporting. In this article, I would like to introduce what reporting is and give you some examples to clarify the key concepts. What is Reporting? All reports address some specific goal.
How to Make Reports Outstanding? In the era of data driving the decision, the importance of reporting and analytics is increasingly recognized by organizations. Two things can help you be a great report maker. The first is clear design thinking, and the second is efficient report writing software. Report Maker Tool List.
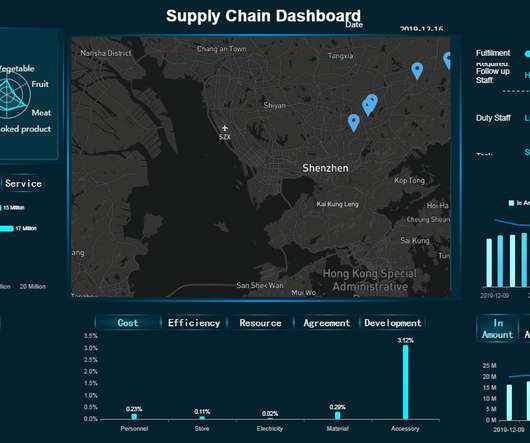
Project dashboard, also known as project management dashboard, helps show the current project progress like a car dashboard and provide feedback to the team. What is a project dashboard? As mentioned above, project dashboard is similar to the car dashboard. reality use of dashboard . Free trial.
Why We Need a Management Dashboard? Therefore, in-flight, trust our dashboard.” ” ——From “The Financial Report is Like a Story Book” by Liu Shunren, a professor at Taiwan University. In layman’s terms, executives can instantly see all the important data needed to make decisions from a dashboard.
With so many digital insights available in our hyper-connected age of information, a professional report tool is the most effective means of collecting, curating, organizing, and analyzing your most valuable business data. Exclusive Bonus Content: Get our free summary to create better reports! What Is Static Reporting?
Among amounts of intelligent choices, business intelligence(BI) dashboard software is an awesome one. BI dashboard software definition. Business intelligence dashboard is a common module that general business intelligence has to realize data visualization. Sales analysis dashboard(by FineReport). FineReport. Advantages.
Marketing dashboard can do you a favor. What is a marketing dashboard? Marketing dashboard is a brief and detailed compilation of all relevant data about the company’s marketing activities, belonging to business intelligence for marketing. Use of Reports and Dashboard. Dashboard Interface of FineReport.
Download our free bite-sized summary and see our top examples! With today’s always-improving technologies, it becomes easier not only to collect such data but also to create comprehensive healthcare reports and convert them into relevant critical insights, that can then be used to provide better care. What Is Big Data In Healthcare?
As important parts of business intelligence, scorecard and dashboard can both play an obvious role in promoting enterprise development. However, limited by factors such as cost and corporate strategies, sometimes companies need to make a choice between scorecard vs dashboard. Definition of scorecard and dashboard. Free trial.
Dive into Mobile Reporting and Analysis. Dive into Mobile Reporting and Analysis. Dive into Mobile Reporting and Analysis. What do you learn from this report? What do you learn from this report? What do you learn from this report? Thank your lucky stars and stop reporting this. (I've
Leading companies make use of KPIs and KPI dashboards to measure their efficiency in real time. Whitepaper: How to Compare Reporting & BI Solutions. Download Now. We just track them with higher precision and accuracy using specialized KPI dashboards. How an Operations Dashboard Can Streamline Your Reporting.
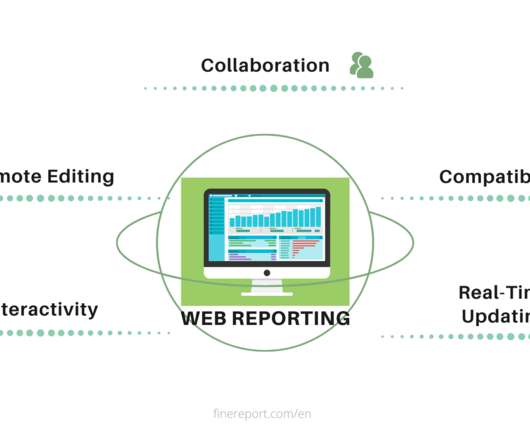
However, thanks to the improvement of information technology and the birth of the browser/server model, Web Reports appear with unprecedented advantages. This article will walk you through the definition and importance of web reports and provide practical solutions. Main Features of Web-based Report. What is Web Report?
What is Project Management Report? A project management report is a high-level overview of the current status of a project. Why is project management report critical? In short, project reporting provides project stakeholders with a window into what’s happening and what to do about it for the entire team.
We organize all of the trending information in your field so you don't have to. Join 42,000+ users and stay up to date on the latest articles your peers are reading.
You know about us, now we want to get to know you!
Let's personalize your content
Let's get even more personalized
We recognize your account from another site in our network, please click 'Send Email' below to continue with verifying your account and setting a password.


Let's personalize your content