Remove Dashboards Remove Events Remove Slice and Dice
article thumbnail

Enhance your analytics embedding experience with the new Amazon QuickSight JavaScript SDK

AWS Big Data

Amazon QuickSight is a fully managed, cloud-native business intelligence (BI) service that makes it easy to connect to your data, create interactive dashboards and reports, and share these with tens of thousands of users, either within QuickSight or embedded in your application or website. The QuickSight SDK v2.0


article thumbnail

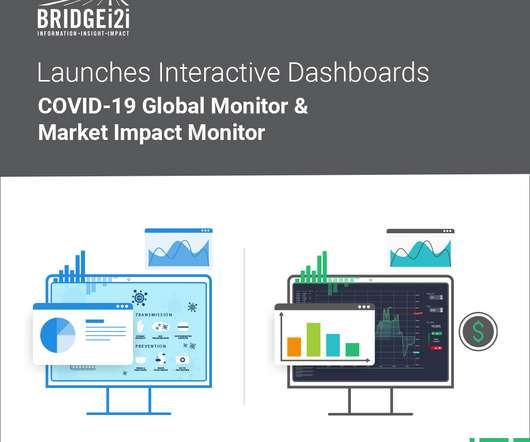
BRIDGEi2i launches two interactive dashboards: COVID19 Global Monitor & COVID Stock Market Impact Monitor

bridgei2i

BRIDGEi2i, a leading AI consultancy, has launched two interactive dashboards that highlight the impact of COVID19 globally across businesses and communities. The Global COVID-19 Monitor gives live insights on the spread of the pandemic across the world and allows you to slice and dice data from many perspectives.

Insiders

Sign Up for our Newsletter

This site is protected by reCAPTCHA and the Google Privacy Policy and Terms of Service apply.

article thumbnail

13 power tips for Microsoft Power BI

CIO Business Intelligence

With Power BI, you can pull data from almost any data source and create dashboards that track the metrics you care about the most. Power BI’s rich reports or dashboards can be embedded into reporting portals you already use. You can drill into data, create a variety of visualizations, and (literally) ask questions about it using AI.

article thumbnail

Simplify Metrics on Apache Druid With Rill Data and Cloudera

Cloudera

Cloudera users can securely connect Rill to a source of event stream data, such as Cloudera DataFlow , model data into Rill’s cloud-based Druid service, and share live operational dashboards within minutes via Rill’s interactive metrics dashboard or any connected BI solution. Figure 1: Rill and Cloudera Architecture.

Metrics 87
article thumbnail

Data Visualization Inspiration: Analysis To Insights To Action, Faster!

Occam's Razor

Short story #4: Multi-dimensional Slicing and Dicing! I believe it is best at describing sequences of events. When I'm creating a dashboard for a high level view, I would take the Treemap above and combine it with the one below that illustrates the amount of Goal Value delivered by each source.

article thumbnail

Semantic Search for Smart Data Discovery in the Pharma Industry

Ontotext

Most important, combining information from various resources and building analytical dashboards leads to much deeper insights and testing of new hypotheses. The information can be sliced and diced using analytical dashboards and interactively explored navigating through the knowledge graph.

article thumbnail

The Bite-Size Future of Business Intelligence

Paul Blogs on BI

He did not think people would consume BI dashboards and perform slice-and-dice or complex drill-down functions on their phones. Santi said he envisioned a future where “Bite-size chunks” of critical BI data would be delivered real-time to people’s mobile devices.