This site uses cookies to improve your experience. To help us insure we adhere to various privacy regulations, please select your country/region of residence. If you do not select a country, we will assume you are from the United States. Select your Cookie Settings or view our Privacy Policy and Terms of Use.
Cookie Settings
Cookies and similar technologies are used on this website for proper function of the website, for tracking performance analytics and for marketing purposes. We and some of our third-party providers may use cookie data for various purposes. Please review the cookie settings below and choose your preference.
Used for the proper function of the website
Used for monitoring website traffic and interactions
Cookie Settings
Cookies and similar technologies are used on this website for proper function of the website, for tracking performance analytics and for marketing purposes. We and some of our third-party providers may use cookie data for various purposes. Please review the cookie settings below and choose your preference.
Strictly Necessary: Used for the proper function of the website
Performance/Analytics: Used for monitoring website traffic and interactions
Disaster recovery is vital for organizations, offering a proactive strategy to mitigate the impact of unforeseen events like system failures, natural disasters, or cyberattacks. This post focuses on introducing an active-passive approach using a snapshot and restore strategy.
Snapshots are crucial for data backup and disaster recovery in Amazon OpenSearch Service. These snapshots allow you to generate backups of your domain indexes and cluster state at specific moments and save them in a reliable storage location such as Amazon Simple Storage Service (Amazon S3). Snapshots are not instantaneous.
in Amazon OpenSearch Service , we introduced Snapshot Management , which automates the process of taking snapshots of your domain. Snapshot Management helps you create point-in-time backups of your domain using OpenSearch Dashboards, including both data and configuration settings (for visualizations and dashboards).
History and versioning : Iceberg’s versioning feature captures every change in table metadata as immutable snapshots, facilitating data integrity, historical views, and rollbacks. Snapshot management allows concurrent data operations without interference, maintaining data consistency across transactions.
With the search relevance plugin, you can now view a side-by-side comparison of results in OpenSearch Dashboards. SS4O is inspired by both OpenTelemetry and the Elastic Common Schema (ECS) and uses Amazon Elastic Container Service ( Amazon ECS ) event logs and OpenTelemetry (OTel) metadata. Additional field types OpenSearch 2.7
In this post, we will review the common architectural patterns of two use cases: Time Series Data Analysis and Event Driven Microservices. The collected data is available in milliseconds to allow real-time analytics use cases, such as real-time dashboards, real-time anomaly detection, and dynamic pricing.
In this use case, Gupshup is heavily relying on Amazon Redshift as their data warehouse to process billions of streaming events every month, performing intricate data-pipeline-like operations on such data and incrementally maintaining a hierarchy of aggregations on top of raw data.
Apache Flink is an open source distributed processing engine, offering powerful programming interfaces for both stream and batch processing, with first-class support for stateful processing and event time semantics. Some things to keep in mind: Stateful downgrades are not compatible and will not be accepted due to snapshot incompatibility.
Key performance indicators (KPIs) of interest for a call center from a near-real-time platform could be calls waiting in the queue, highlighted in a performance dashboard within a few seconds of data ingestion from call center streams. This may require frequent truncation in certain tables to retain only the latest stream of events.
Dashboards aren’t supposed to take forever. Dashboards are supposed to be fast and easy. In this article, you’ll see examples of real dashboards that you can use as inspiration for your own workplace. Adapt one of these dashboards instead. They’re not supposed to cost an arm and a leg. That’s it!
It also offers first-class support for stateful processing and event time semantics. As of this writing, the Managed Service for Apache Flink application still shows a RUNNING status when such errors occur, despite the fact that the underlying Flink application cannot process the incoming events and recover from the errors.
See the snapshot below. HDFS also provides snapshotting, inter-cluster replication, and disaster recovery. . Includes a drag-n-drop style, GUI-based Search Dashboard Designer. You can use this to build simple dashboards for PoC or other exploratory purposes, out of the box. data best served through Apache Solr).
Apache Kafka is a high-throughput, low-latency distributed event streaming platform. Apache Flink is an opensource distributed processing engine, offering powerful programming interfaces for both stream and batch processing, with first-class support for stateful processing, event time semantics, checkpointing, snapshots and rollback.
To centralize monitoring, you can add these metrics to an existing CloudWatch dashboard or a new dashboard. On the Actions menu, choose Add to dashboard. Let’s take an example where you have to create a serverless workgroup for your dashboards. You know that dashboard queries typically complete in under a minute.
For example, in a chatbot, data events could pertain to an inventory of flights and hotels or price changes that are constantly ingested to a streaming storage engine. Furthermore, data events are filtered, enriched, and transformed to a consumable format using a stream processor.
Through Amazon Redshift in-memory result set caching and compilation caching, workloads ranging from dashboarding to visualization to business intelligence (BI) that run repeat queries experience a significant performance boost. When a usage limit threshold is reached, events are also logged to a system table.
Lastly, we use Amazon QuickSight to gain insights on the modeled data in the form of a QuickSight dashboard. For this solution, we use a sample dataset (normalized) provided by Amazon Redshift for event ticket sales. Additionally, we add a fifth step for demonstration purposes, which is to report and analyze business events.
How to Build Useful KPI Dashboards. Listed below are 10 examples of lean manufacturing KPIs: Machine Downtime Rate – While this is commonly used as a manufacturing metric to give a general snapshot of how operation is going, it doesn’t paint a full picture. This is where KPIs for the manufacturing industry come into play.
It also opens up the opportunity to bring in a whole new self-service audience to using the ad-hoc query and analysis capabilities of Webi as well as consume intuitive Webi dashboards. Then, a quick Tableau dashboard visualization with a map of the US was built from the Hyper and the States were linked back to another Web intelligence report.
There was always a delay between the events being recorded in financial systems (for example, the purchase of a product or service) and the ability to put that information in context and draw useful conclusions from it (for example, a weekly sales report). Such BI methodologies are built on a snapshot of what happened in the past.
Apache Flink is an open source distributed processing engine, offering powerful programming interfaces for both stream and batch processing, with first-class support for stateful processing and event time semantics. You can find valuable statistics you can’t normally find elsewhere, including the Apache Flink Dashboard.
xlplus) with at least two nodes, or Redshift Serverless Encrypted (if using a provisioned cluster) For this post, we create and configure a Redshift Serverless workgroup and namespace as the target data warehouse, following these steps: On the Amazon Redshift console, choose Serverless dashboard in the navigation pane.
You can perform real-time transaction processing on data in Aurora while simultaneously using Amazon Redshift for analytics workloads such as reporting and dashboards. Solution overview Let’s consider TICKIT , a fictional website where users buy and sell tickets online for sporting events, shows, and concerts.
Logs Logs include discrete events recorded every time something occurs in the system, such as status or error messages, or transaction details. Kubernetes tends to capture data “snapshots,” or information captured at a specific point in the lifecycle. Kubernetes logs can be written in both structured and unstructured text.
During the upgrade process, Amazon MWAA captures a snapshot of your environment metadata; upgrades the workers, schedulers, and web server to the new Airflow version; and finally restores the metadata database using the snapshot, backing it with an automated rollback mechanism.
You can continue with your transaction processing on Amazon RDS or Amazon Aurora while simultaneously using Amazon Redshift for analytics workloads such as reporting and dashboards. Solution overview Let’s consider TICKIT , a fictional website where users buy and sell tickets online for sporting events, shows, and concerts.
Every event in the data source can be relevant, and our customers don’t tolerate data loss, poor data quality, or discrepancies between the source and Tricentis Analytics. The main idea of this architecture is to be event-driven with eventual consistency. Finally, data integrity is of paramount importance.
You don’t need to worry about workloads such as ETL (extract, transform, and load), dashboards, ad-hoc queries, and so on interfering with each other. You can access data with traditional, cloud-native, containerized, serverless web services or event-driven applications. Deselect Create final snapshot.
We might find the root cause by realizing that a problem recurs at a particular time, or coincides with another event. . After moving to CDP, take a snapshot to use as a CDP baseline. BI Interactive Reports or Dashboards. BI Interactive Reports or Dashboards. Fixed Reports / Data Engineering Jobs. Report Format.
How to Build Useful KPI Dashboards. This key financial metric gives a snapshot of the financial health of your company by measuring the amount of cash generated by normal business operations. This is often best handled by a KPI dashboard. This financial KPI gives you a quick snapshot of a business’ financial health.
Poshmark wanted to address the following business use cases via the real-time analytics platform: Sessionization – Poshmark captures both server-side application events and client-side tracking events. They wanted to use these events to identify and analyze user sessions to track behavior. The event data format is nested JSON.
Really pick any report with any dimension you want to look at, we spend our time (and valuable space on our dashboards) looking at the top ten. Why keep reporting the top ten keywords on you Executive Management Global KPI Dashboard? Let me share two snapshots to make that point. Referring URL's. Pages viewed. Promotions.
Snapshot testing augments debugging capabilities by recording past table states, facilitating the identification of unforeseen spikes, declines, or abnormalities before their effect on production systems. Each row provides a brief description of how dbt assists in testing and reporting test results for data transformations and conversions.
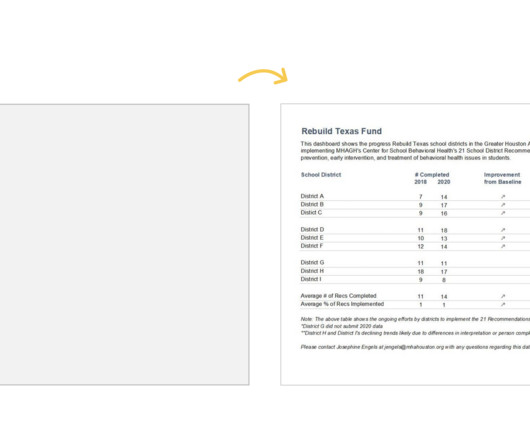
A stewardship dashboard, to track assets most ripe for curation and curation progress. An example of a stewardship dashboard for governance progress tracking. Stewardship dashboards. AI and ML are used in concert to predict possible events and model outcomes. A BI dashboard supports of-the-moment decision making.
By combining the art of storytelling with the technological capabilities of dashboard software , it’s possible to develop powerful, meaningful, data-backed presentations that not only move people but also inspire them to take action or make informed, data-driven decisions that will benefit your business. What Is Dashboard Storytelling?
Auto recovery of multi-AZ deployment In the unlikely event of an Availability Zone failure, Amazon Redshift Multi-AZ deployments continue to serve your workloads by automatically using resources in the other Availability Zone. Choose the Maintenance Select a snapshot and choose Restore snapshot , Restore to provisioned cluster.
That might be a sales performance dashboard for your Chief Revenue Officer, a snapshot of “days sales outstanding” (DSO) for the A/R collections team, or an item sales trend analysis for product management. You’ll also find things like an FTE trend analysis, a regional sales performance dashboard, and a variety of P&L formats.
And we started creating dashboards of the situation within each location around the world, and we got into a regular rhythm of triaging the situation and figuring out what we needed to do along the way. As you know, we have a strong set of capabilities around Power BI to be able to create dashboards.
This might include a recap of the company’s strategic priorities, a summary of major events that have occurred over the past year, and a brief overview of market dynamics for your industry. Modern executive dashboards provide a wealth of information in easily digestible formats, often in mere seconds. No high pressure sales pitch.
Interactive reports, visualizations, and dashboards that cover common financial and operational reporting needs. And that is only a snapshot of the benefits your finance users will enjoy with Angles for Deltek. Interested in Business Analytics and Dashboards. Get up and running immediately with no installation required.
This might include a recap of the company’s strategic priorities, a summary of major events that have occurred over the past year, and a brief overview of market dynamics for your industry. Modern executive dashboards provide a wealth of information in easily digestible formats, often in mere seconds. Privacy Policy.
Project status reports are critical to see a snapshot of where projects are from a task level. Summary reports tend to be at a higher level and can take several forms, such as a dashboard or an executive summary. Despite their broad nature, leadership can also use them to drill down on details. Privacy Policy.
Limited Visibility and Insights : Static reports offer a snapshot in time and fail to capture the nuances of your financial performance. Automate your financial reporting, improve your budgeting and planning cycles, and close skills gaps by empowering business teams to create reports and dashboards independently. Privacy Policy.
We organize all of the trending information in your field so you don't have to. Join 42,000+ users and stay up to date on the latest articles your peers are reading.
You know about us, now we want to get to know you!
Let's personalize your content
Let's get even more personalized
We recognize your account from another site in our network, please click 'Send Email' below to continue with verifying your account and setting a password.


Let's personalize your content