Streamlit vs Gradio – A Guide to Building Dashboards in Python
Analytics Vidhya
FEBRUARY 20, 2023
As the demand for ML models increases, so makes the demand for user-friendly interfaces to interact with these models.
This site uses cookies to improve your experience. To help us insure we adhere to various privacy regulations, please select your country/region of residence. If you do not select a country, we will assume you are from the United States. Select your Cookie Settings or view our Privacy Policy and Terms of Use.
Cookies and similar technologies are used on this website for proper function of the website, for tracking performance analytics and for marketing purposes. We and some of our third-party providers may use cookie data for various purposes. Please review the cookie settings below and choose your preference.
Used for the proper function of the website
Used for monitoring website traffic and interactions
Cookies and similar technologies are used on this website for proper function of the website, for tracking performance analytics and for marketing purposes. We and some of our third-party providers may use cookie data for various purposes. Please review the cookie settings below and choose your preference.

Analytics Vidhya
FEBRUARY 20, 2023
As the demand for ML models increases, so makes the demand for user-friendly interfaces to interact with these models.

datapine
SEPTEMBER 4, 2019
This is where the power of business dashboards comes into play. Dashboards often are the best way to gain insight into an organization and its various departments, operations and performance. Well-built, focused dashboards easily serve up summaries and reports of the BI that’s most critical to the organization.
This site is protected by reCAPTCHA and the Google Privacy Policy and Terms of Service apply.

datapine
AUGUST 14, 2020
A customer retention dashboard and metrics depicted in a neat visual will help you in monitoring, analyzing, and managing multiple customer-centric points and how they echo in your business. Your Chance: Want to build a dashboard for customer retention? Try our professional dashboard software for 14 days, completely free!

datapine
AUGUST 7, 2019
That’s where SaaS dashboards enter the fold. A SaaS dashboard is a powerful business intelligence tool that offers a host of benefits for ambitious tech businesses. Exclusive Bonus Content: Your Definitive Guide to SaaS & Dashboards! Geet our bite-sized free summary and start building your dashboards!

Advertisement
But today, dashboards and visualizations have become table stakes. Think your customers will pay more for data visualizations in your application? Five years ago they may have. Discover which features will differentiate your application and maximize the ROI of your embedded analytics. Brought to you by Logi Analytics.

Smart Data Collective
DECEMBER 2, 2020
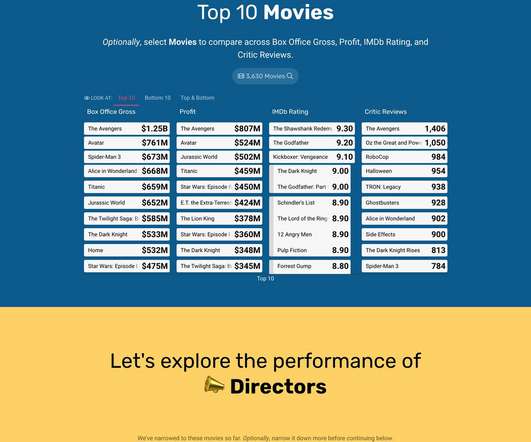
If the work of a human’s mind can be somehow represented, interactive data visualization is the closest form of such representation right before pure art. So, what is Interactive data visualization and how are they driven by modern interactive data visualization tools? What is interactive data visualization software?
Juice Analytics
MARCH 1, 2021
The one-page dashboard was once the predominant form of visualizing data. With touch screens, mobile devices, on-demand data, and interfaces crafted for interaction and user experience, the one-page dashboard is a relic. Use cases for one-page dashboards exist, but they are increasingly rare. It seldom is.

datapine
NOVEMBER 27, 2019
Spreadsheets finally took a backseat to actionable and insightful data visualizations and interactive business dashboards. The predictive models, in practice, use mathematical models to predict future happenings, in other words, forecast engines. Over the past decade, business intelligence has been revolutionized.

datapine
JUNE 4, 2020
To successfully gain control and improve a company’s technological needs, CTO dashboards and reports are needed as invaluable tools that consolidate multiple data points and support chief officers in strategic developments as well as online data analysis efforts, empowering their status of champions for new solutions.

datapine
JULY 26, 2022
1) What Is A Small Business Dashboard? 3) Why Do You Need Small Business Dashboards. 4) Small Business Dashboard & KPIs Examples. Enter small business dashboards and metrics. BI dashboard tools provide smaller businesses with valuable insights regarding their operations thanks to real-time access to data.

CIO Business Intelligence
FEBRUARY 6, 2025
The hype around large language models (LLMs) is undeniable. They promise to revolutionize how we interact with data, generating human-quality text, understanding natural language and transforming data in ways we never thought possible. Tableau, Qlik and Power BI can handle interactive dashboards and visualizations.

Cloudera
JUNE 26, 2024
In today’s data-driven world, businesses rely heavily on their dashboards to make informed decisions. However, traditional dashboards often lack the intuitive interface needed to truly harness the power of data. Say goodbye to static dashboards and hello to a whole new level of engagement.

datapine
SEPTEMBER 1, 2020
Today, there are online data visualization tools that make it easy and fast to build powerful market-centric research dashboards. On a typical market research results example, you can interact with valuable trends, gain an insight into consumer behavior, and visualizations that will empower you to conduct effective competitor analysis.
Sisense
JANUARY 6, 2021
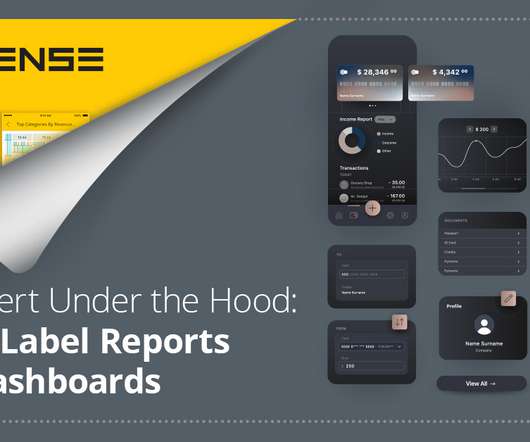
What are white-labeled reports White-label reports: Under the hood Exploring white-label dashboards Use case snapshots Horsepower under the hood. The ability to add best-in-class dashboards to your app but brand them as your own gives your app a new pathway to success without expending serious dev time. What are white-labeled reports?

Smart Data Collective
SEPTEMBER 14, 2020
They also use trend forecasting and customer behavioral analysis to adapt their business models to boost business. However, none of these features would be viable without web dashboards. We talked about the benefits of business dashboards before , but web dashboards have their own benefits. What is a web dashboard?

datapine
MAY 11, 2022
This is possible thanks to the user-friendly approach of modern online data analysis tools that allow an average user, without the need for any technical knowledge, to use data in the shape of interactive graphs and charts in their decisions making process. Gauge charts can be effectively used with a single value or data point. d) Area chart.

CIO Business Intelligence
NOVEMBER 4, 2024
The Cybersecurity Maturity Model Certification (CMMC) serves a vital purpose in that it protects the Department of Defense’s data. Myrddin is now part of our CMMC dashboard tool that assists users in conducting gap assessments and interpreting cybersecurity compliance guidelines,” says Birmingham. “It

datapine
NOVEMBER 11, 2021
c) Dashboard Features. Business intelligence tools provide you with interactive BI dashboards that serve as powerful communication tools to keep teams engaged and connected. 3) Dashboards. Here you will find some of the main BI tool features related to dashboard management: a) Built-in dashboard templates.

Smart Data Collective
OCTOBER 5, 2020
Microsoft Power BI is a Business Intelligence and Data Visualization tool which assists organizations to analyze data from multiple sources, convert it into an interactive dashboard and share insights. It provides rich & customized dashboards and reports to meet your needs. This option is straightforward and convenient.
FineReport
SEPTEMBER 7, 2021
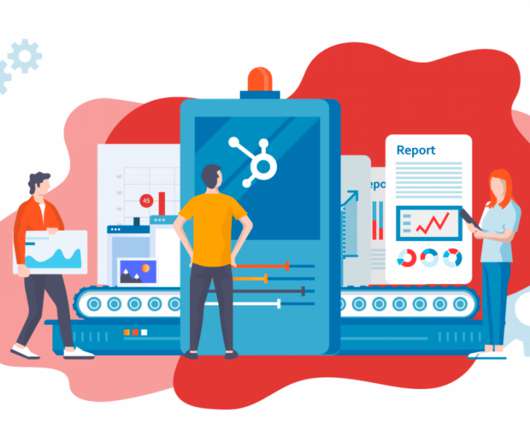
One of the most difficult problems faced by marketers is how to analyze all the information, which comes from customer surveys, from complex computer models, and from various channels. Marketing dashboard can do you a favor. What is a marketing dashboard? Use of Reports and Dashboard. Dashboard Interface of FineReport.

CIO Business Intelligence
JANUARY 9, 2025
Generative artificial intelligence ( genAI ) and in particular large language models ( LLMs ) are changing the way companies develop and deliver software. GenAI as ubiquitous technology In the coming years, AI will evolve from an explicit, opaque tool with direct user interaction to a seamlessly integrated component in the feature set.

erwin
FEBRUARY 20, 2020
Enterprise architecture (EA) and business process (BP) modeling tools are evolving at a rapid pace. The combined solution enables organizations to map IT capabilities to the business functions they support and determine how people, processes, data, technologies and applications interact to ensure alignment in achieving enterprise objectives.

datapine
FEBRUARY 4, 2020
While your keyboard is burning and your fingers try to keep up with your brain and comprehend all the data you’re writing about, using an interactive online data visualization tool to set specific time parameters or goals you’ve been tracking can bring a lot of saved time and, consequently, a lot of saved money. 1) Web Analytics Report.

O'Reilly on Data
AUGUST 18, 2020
However, while Cloudera, Hortonworks, and MapR worked well for a set of common data engineering workloads, they didn’t generalize well to workloads that didn’t fit the MapReduce paradigm, including deep learning and new natural language models. Let’s dive into these reasons in more depth. Data Science and Machine Learning Require Flexibility.

datapine
MARCH 25, 2022
While some experts try to underline that BA focuses, also, on predictive modeling and advanced statistics to evaluate what will happen in the future, BI is more focused on the present moment of data, making the decision based on current insights. Asking the right business intelligence questions will lead you to better analytics.

datapine
APRIL 15, 2020
It’s necessary to say that these processes are recurrent and require continuous evolution of reports, online data visualization , dashboards, and new functionalities to adapt current processes and develop new ones. In the traditional model communication between developers and business users is not a priority.

O'Reilly on Data
MARCH 24, 2020
In a world focused on buzzword-driven models and algorithms, you’d be forgiven for forgetting about the unreasonable importance of data preparation and quality: your models are only as good as the data you feed them. If you’re basing business decisions on dashboards or the results of online experiments, you need to have the right data.
AWS Big Data
MARCH 13, 2025
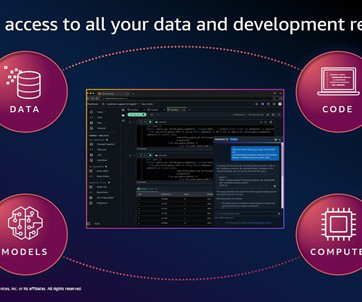
From within the unified studio, you can discover data and AI assets from across your organization, then work together in projects to securely build and share analytics and AI artifacts, including data, models, and generative AI applications. Configuring and governing access is also a cumbersome manual process.

datapine
OCTOBER 7, 2020
Turning these datasets into a business dashboard can effectively track the right values and offer a comprehensive application to the entire business system. The CPC (cost-per-click) overview of campaigns is an operational metric that expounds on the standard pricing model in online advertising. Let’s see this through an example.

O'Reilly on Data
OCTOBER 11, 2022
Data integration problems aren’t pretty; they’re boring, uninteresting, the “killing field of any modeling project,” as Lorien Pratt has said. The models exist, and are potentially very useful; but on the ground, firefighters and others who respond to emergencies still use paper maps. This leads to a “knowledge decision gap.”

O'Reilly on Data
JULY 15, 2019
In recent posts, we described requisite foundational technologies needed to sustain machine learning practices within organizations, and specialized tools for model development, model governance, and model operations/testing/monitoring. Sources of model risk. Model risk management. Image by Ben Lorica.

AWS Big Data
DECEMBER 5, 2024
However, it wouldn’t be wise to display an excessive number of metrics on our monitoring dashboards because that could lead to less clarity and slower insights on the cluster. Capacity monitoring dashboards As part of our platform management process, we conduct monthly operational reviews to maintain optimal performance.

O'Reilly on Data
MAY 21, 2019
Companies successfully adopt machine learning either by building on existing data products and services, or by modernizing existing models and algorithms. For example, in a July 2018 survey that drew more than 11,000 respondents, we found strong engagement among companies: 51% stated they already had machine learning models in production.

CIO Business Intelligence
SEPTEMBER 6, 2024
The complexity of handling data—from writing intricate SQL queries to developing machine learning models—can be overwhelming and time-consuming. These AI-driven solutions are coming to the forefront of transforming how IT professionals interact with and leverage data, making their everyday roles more efficient and impactful.

Cloudera
OCTOBER 23, 2024
It enables easy integration and interaction with Iceberg table metadata via an API and also decouples metadata management from the underlying storage. The Iceberg REST catalog specification is a key component for making Iceberg tables available and discoverable by many different tools and execution engines.

datapine
JANUARY 6, 2022
6) The Use of Dashboards For Data Interpretation. Business dashboards are the digital age tools for big data. Through the art of streamlined visual communication, data dashboards permit businesses to engage in real-time and informed decision-making and are key instruments in data interpretation. 2) How To Interpret Data?

datapine
DECEMBER 11, 2019
SaaS is a software distribution model that offers a lot of agility and cost-effectiveness for companies, which is why it’s such a reliable option for numerous business models and industries. Flexible payment options: Businesses don’t have to go through the expense of purchasing software and hardware.

datapine
MARCH 31, 2022
For example, if you enjoy computer science, programming, and data but are too extroverted to program all day long, you could work in a more human-oriented area of intelligence for business, perhaps involving more face-to-face interactions than most programmers would encounter on the job. Main Challenges Of A Business Intelligence Career.

CIO Business Intelligence
NOVEMBER 14, 2022
Decision support systems definition A decision support system (DSS) is an interactive information system that analyzes large volumes of data for informing business decisions. A DSS leverages a combination of raw data, documents, personal knowledge, and/or business models to help users make decisions. ERP dashboards.

AWS Big Data
FEBRUARY 21, 2025
Artificial intelligence (AI) has transformed how humans interact with information in two major wayssearch applications and generative AI. Youll learn about how AI-powered search systems employ foundation models (FMs) to capture and search context and meaning across text, images, audio, and video, delivering more accurate results to users.

datapine
APRIL 21, 2022
In other words, it means employing technology to constantly improve the whole company model, including its offerings, customer service, and operations. Several marketing dashboard tools allow you to generate automated online dashboards and reports to track your most relevant KPIs in one place. Approach To Digital Marketing.

CIO Business Intelligence
OCTOBER 31, 2024
Reitz has set up a global service model with hubs in three time zones that operate according to the follow-the-sun approach. Dashboards and a zero trust strategy also help control the security situation. It all starts with a sense of presence, both remote and local.

CIO Business Intelligence
AUGUST 21, 2024
The last major change in networking software was moving from CLI to cloud management via dashboards, sacrificing precision for accessibility along the way. It combines the precision of the CLI with the visual intuitiveness of dashboards and adds a layer of natural language interaction. Your network. At your command.

datapine
MAY 2, 2023
The rise of SaaS business intelligence tools is answering that need, providing a dynamic vessel for presenting and interacting with essential insights in a way that is digestible and accessible. In a recent move towards a more autonomous logistical future, Amazon has launched an upgraded model of its highly-successful KIVA robots.
Expert insights. Personalized for you.
We have resent the email to
Are you sure you want to cancel your subscriptions?


Let's personalize your content