This site uses cookies to improve your experience. To help us insure we adhere to various privacy regulations, please select your country/region of residence. If you do not select a country, we will assume you are from the United States. Select your Cookie Settings or view our Privacy Policy and Terms of Use.
Cookie Settings
Cookies and similar technologies are used on this website for proper function of the website, for tracking performance analytics and for marketing purposes. We and some of our third-party providers may use cookie data for various purposes. Please review the cookie settings below and choose your preference.
Used for the proper function of the website
Used for monitoring website traffic and interactions
Cookie Settings
Cookies and similar technologies are used on this website for proper function of the website, for tracking performance analytics and for marketing purposes. We and some of our third-party providers may use cookie data for various purposes. Please review the cookie settings below and choose your preference.
Strictly Necessary: Used for the proper function of the website
Performance/Analytics: Used for monitoring website traffic and interactions
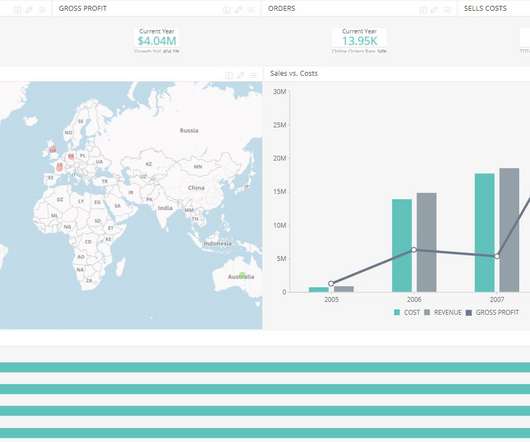
Enter data dashboards – one of history’s best innovations in business intelligence. To help you understand this notion in full, we’re going to explore a data dashboard definition, explain the power of dashboard data, and explore a selection of data dashboard examples. What Is A Data Dashboard? click to enlarge**.
The rise of innovative, interactive, data-driven dashboard tools has made creating effective dashboards – like the one featured above – swift, simple, and accessible to today’s forward-thinking businesses. Dashboard design should be the cherry on top of your business intelligence (BI) project. Consider your end goal.
This is where the power of business dashboards comes into play. Dashboards often are the best way to gain insight into an organization and its various departments, operations and performance. Well-built, focused dashboards easily serve up summaries and reports of the BI that’s most critical to the organization.
An Operations KeyPerformanceIndicator (KPI) or metric is a discrete measurement that a company uses to monitor and evaluate the efficiency of its day-to-day operations. Leading companies make use of KPIs and KPI dashboards to measure their efficiency in real time. Manufacturing. What is an Operations KPI?
Typically presented in the form of an interactive dashboard , this kind of report provides a visual representation of the data associated with your predetermined set of keyperformanceindicators – or KPI data, for short. Pick a couple of indicators that will track and assess the performance.
An online BI dashboard. Thanks to specific business intelligence best practices for dashboard design. Exclusive Bonus Content: Download Our Free Dashboard Checklist! Get the free guide with great tips for your dashboard implementation! What Is The Definition Of A BI Dashboard? How can you create one?
Spreadsheets finally took a backseat to actionable and insightful data visualizations and interactive business dashboards. That’s why it is of utmost importance to start with utilizing the right keyperformanceindicators – there are numerous KPI examples that can make or break the quality process of data management.
4) How to Select Your KPIs 5) Avoid These KPI Mistakes 6) How To Choose A KPI Management Solution 7) KPI Management Examples Fact: 100% of statistics strategically placed at the top of blog posts are a direct result of people studying the dynamics of KeyPerformanceIndicators, or KPIs. What Is KPI Management?
What Is A Manufacturing KPI? A manufacturingKeyPerformanceIndicator (KPI) or metric is a well defined and quantifiable measure that the manufacturing industry uses to gauge its performance over time. Why Your Company Should Be Using Manufacturing Specific KPIs to Stay Competitive.
6) The Use of Dashboards For Data Interpretation. Business dashboards are the digital age tools for big data. Through the art of streamlined visual communication, data dashboards permit businesses to engage in real-time and informed decision-making and are key instruments in data interpretation. 2) How To Interpret Data?
An engineering KeyPerformanceIndicator (KPI) or metric is a clearly defined quantifiable measure that an engineering firm uses to gauge its success over time. With engineering being a very broad field, KPIs are employed in a variety of ways, ranging from company-wide analysis to project specific performance metrics.
To help you get started with the topic, we put together this insightful guide on modern performance reporting using professional online dashboards. Keep reading to find a definition, benefits, examples, and some key best practices to generate them successfully! What Is A Performance Report?
That said, there are various methods and tools businesses use to manage their data and optimize their performance. One of the most powerful ones being keyperformanceindicators (KPIs). One of the greatest mistakes companies make when dealing with keyperformanceindicators is thinking they work on their own.
An extraordinary amount of time, effort, $$$ are spent on building dashboards/scorecards for CMOs… Yet, the end result, nearly always, is a useless data puke. CMO dashboards end up being useless when capabilities exceed needs. Personal Bias: I prefer the word Scorecard over Dashboard. Performance-leading 3. Bottom line.
Have no idea how to select keyperformanceindicators from piles of indicators? KPI dashboard releases you from your worries and troubles. What is a KPI dashboard? Definition of KPI dashboard. Reality Use of KPI Dashboard. Importance & Benefits of KPI dashboard.
Image credit: Tom Fishburne Keyperformanceindicators (KPIs) are specific measures of the success and health of a business, and if you don't have these crucial gauges or ignore them, you’re essentially flying blind. And that story never ends well. KPIs are always tied to particular objectives or desired outcomes. Read More
Regardless of where organizations are in their digital transformation, CIOs must provide their board of directors, executive committees, and employees definitions of successful outcomes and measurable keyperformanceindicators (KPIs). Efficiency metrics might show the impacts of automation and data-driven decision-making.
Many of these tools also include customizable dashboards that can show keyperformanceindicators, strategic alignment, risk assessments, and progress on initiatives. Other organizations choose to integrate modeling tools that work well with their chosen framework, like ArchiMate or UML.
Whether calculated directly or indirectly, it indicates how successful a company is at its core business activities, from manufacturing goods to providing services. Since it indicates the amount of short-term cash a business has on hand, operating cash flow guides companies through their most immediate and important decisions.
In today’s data-driven landscape, businesses are leaning more on BI tools , particularly BI dashboard solutions, to enhance decision-making through data visualization. These BI Dashboard tools blend advanced analytics with user-friendly interfaces, revealing invaluable insights.
Modern business dashboard tools allow a wider audience to comprehend and disseminate the report findings. 8) KPI report : Monitors and measures KeyPerformanceIndicators ( KPIs ) to assess if your operations deliver the expected results. Consider creating a dashboard presentation. Know Your Target Audience.
When reading/writing the contract, you must be specific,” says Charles Scharnagle, CIO at manufacturer Revere Copper Products. These tools can include project management software, shared dashboards, or task tracking spreadsheets,” Sonty says. It’s also important to have performance metrics in place.
In this article, we will explore the concept of KPI tracking, its definition, its importance for businesses, and how to perform KPI tracking. Additionally, we will provide real-life examples of KPI tracking dashboards and a step-by-step guide to setting up your own dashboard. What Is KPI Tracking? Free Download of FineReport 1.
Data drives everything in the business world, from manufacturing to supply chain logistics to retail sales to customer experience to post-sale marketing and beyond, data holds the secrets to making processes more efficient, production costs cheaper, profit margins higher and marketing campaigns more effective.
But what about a Data Journey constructed from multiple data engineering tools, servers, data sets, and dashboards? Here are a set of simple, general keyperformanceindicators (KPIs) that can be used to evaluate the performance of a data analytics team. To that specific user, it is. Data systems require trust.
OBIEE is a strategic BI tool that provides a web platform with attractive dashboards suitable for C-level needs. Interactive dashboards that provide reports with a rich variety of visualization tools. Nice UI – Great dashboards for C-level executives. Good aggregation – Impressive summary data.
A distribution KeyPerformanceIndicator (KPI) or metric is a measure that a company in the distribution sector uses to monitor its performance and efficiency. Distribution is the often-forgotten little brother of manufacturing. Most people are interested in utilizing KPIs to improve their manufacturing efficiency.
Rich Components and Quick Navigation through Directory Search Fully compatible with the PC data portal, the mobile data portal supports functions such as Banner, Bulletin Board, Quick Entry, Data Dashboards, and Reports Dynamics to meet the requirements of standard portal scenarios. Application Scenarios 1.
With the introduction of Artificial Intelligence and Machine Learning, as well as data visualization tools, designed for charting, dashboards and performance scorecards. Can they easily define access, manage dashboards, etc. The market is forecasted to achieve nearly a 23% growth over the next three years.
A retail KeyPerformanceIndicator (KPI) or metric is a clearly defined and quantifiable measure that can be used to assess the performance of a retail business. These performance metrics can be used in a variety of ways. To help business owners with their analytics, we recommend the use of a retail KPI dashboard.
These tools allowed users to monitor keyperformanceindicators (KPIs), reports and other metrics in a dashboard environment using many of the same features and tools they enjoyed in a desktop based application. Businesses can establish keyperformanceindicators (KPIs) to track metrics to enhance care and treatment.
It provides modules to monitor and manage data for accounting, finance, sales, purchasing, manufacturing, inventory, branch management and statutory compliance with job costing, payroll, point of sales and other tools. and provide contribution analysis and keyperformanceindicators (KPIs).
You can find similar use cases in other industries such as retail, car manufacturing, energy, and the financial industry. Feedback analytics and fine-tuning It’s important for data operation managers and AI/ML developers to get insight about the performance of the generative AI application and the FMs in use.
With so much data available to today’s brands and businesses, to extract every drop of value from an ever-growing raft of digital insights and set the kind of KPIs that will drive your venture forward, having an easy to use, a visually-stunning dashboard is key. Exclusive Bonus Content: 15 Powerful Dashboard Ideas: A Summary.
Year-over-year (YOY) growth is a keyperformanceindicator comparing growth in one period (usually a month) against the comparable period twelve months before the previous year, hence the name). See it in action: Explore Dashboard. Manufacturing : Factories live and die by how efficient their production lines are.
An accounting KeyPerformanceIndicator (KPI) or metric is an explicitly defined and quantifiable measure that the accounting industry uses to gauge its overall long-term performance. KPIs for accounting departments differ based on the type of accounting function they perform. How to Build Useful KPI Dashboards.
A logistics keyperformanceindicator (KPI) is a quantitative tool used by businesses to measure performance within their logistics department. A logistics keyperformanceindicator (KPI) is a quantitative tool used by businesses to measure performance within their logistics department.
A chief executive officer (CEO) keyperformanceindicator (KPI) or metric is a relative performance measure that a CEO will use to make informed decisions. Financial KPIs for the CEO’s Dashboard. Gross Profit Margin : This financial metric is perfect for a CEO KPI dashboard. What is a CEO KPI?
A government keyperformanceindicator (KPI) is a quantifiable measure that the public sector uses to evaluate its performance. Government KPIs function like KPIs used by for-profit businesses — they demonstrate the organization’s overall performance and its accountability to its stakeholders.
Executive dashboards help key business decision-makers stay focused on those “big rocks.” What Is an Executive Dashboard? Executive dashboards are useful because they provide a consolidated view of the numbers that matter most. What Makes a Good Executive Dashboard?
And Manufacturing and Technology, both 11.6 Their dashboards were visually stunning. In turn, end users were thrilled with the bells and whistles of charts, graphs, and dashboards. Yes—but basic dashboards won’t be enough. The industries that are users of embedded analytics are interesting. percent, and Healthcare, 12.1
A university keyperformanceindicator (KPI) is a performance analyzer used to evaluate the competition between universities. They are often used to get a bird’s eye view of performance and are also known as metrics. How to Build Useful KPI Dashboards. What are University KPIs? Download Now.
Many organizations look to this as the single most important supply chain keyperformanceindicator (KPI) because it directly impacts customer satisfaction. #3. It’s not uncommon, for example, for manufacturers to expedite shipments of incoming raw materials to ensure that they can deliver a customer order on time.
A supply chain keyperformanceindicator (KPI) is a quantitative measure that evaluates the effectiveness and performance of a company’s supply chain. This network consists of manufacturers, vendors, warehouses, transportation, distribution centers, and retailers. How to Build Useful KPI Dashboards.
We organize all of the trending information in your field so you don't have to. Join 42,000+ users and stay up to date on the latest articles your peers are reading.
You know about us, now we want to get to know you!
Let's personalize your content
Let's get even more personalized
We recognize your account from another site in our network, please click 'Send Email' below to continue with verifying your account and setting a password.


Let's personalize your content