This site uses cookies to improve your experience. To help us insure we adhere to various privacy regulations, please select your country/region of residence. If you do not select a country, we will assume you are from the United States. Select your Cookie Settings or view our Privacy Policy and Terms of Use.
Cookie Settings
Cookies and similar technologies are used on this website for proper function of the website, for tracking performance analytics and for marketing purposes. We and some of our third-party providers may use cookie data for various purposes. Please review the cookie settings below and choose your preference.
Used for the proper function of the website
Used for monitoring website traffic and interactions
Cookie Settings
Cookies and similar technologies are used on this website for proper function of the website, for tracking performance analytics and for marketing purposes. We and some of our third-party providers may use cookie data for various purposes. Please review the cookie settings below and choose your preference.
Strictly Necessary: Used for the proper function of the website
Performance/Analytics: Used for monitoring website traffic and interactions
Now With Actionable, Automatic, Data Quality Dashboards Imagine a tool that can point at any dataset, learn from your data, screen for typical data quality issues, and then automatically generate and perform powerful tests, analyzing and scoring your data to pinpoint issues before they snowball. New Quality Dashboard & Score Explorer.
In this blog post, we’ll discuss how the metadata layer of Apache Iceberg can be used to make data lakes more efficient. You will learn about an open-source solution that can collect important metrics from the Iceberg metadata layer. This ensures that each change is tracked and reversible, enhancing data governance and auditability.
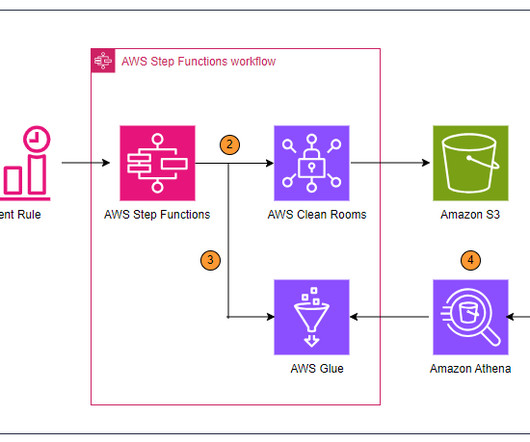
In the following section, two use cases demonstrate how the data mesh is established with Amazon DataZone to better facilitate machine learning for an IoT-based digital twin and BI dashboards and reporting using Tableau. From here, the metadata is published to Amazon DataZone by using AWS Glue Data Catalog.
First, what active metadata management isn’t : “Okay, you metadata! Now, what active metadata management is (well, kind of): “Okay, you metadata! Metadata are the details on those tools: what they are, what to use them for, what to use them with. . That takes active metadata management. Quit lounging around!
Customers can also implement their own custom dashboards in QuickSight. The Eightfold Talent Intelligence Platform integrates with Amazon Redshift metadata security to implement visibility of data catalog listing of names of databases, schemas, tables, views, stored procedures, and functions in Amazon Redshift.
In August, we wrote about how in a future where distributed data architectures are inevitable, unifying and managing operational and business metadata is critical to successfully maximizing the value of data, analytics, and AI. It is a critical feature for delivering unified access to data in distributed, multi-engine architectures.
You have metrics available per job run within the AWS Glue console, but they don’t cover all available AWS Glue job metrics, and the visuals aren’t as interactive compared to the QuickSight dashboard. In the following sections, we show you how to set up the solution, explore the dashboards, and configure alarms.
Amazon Q generative SQL for Amazon Redshift uses generative AI to analyze user intent, query patterns, and schema metadata to identify common SQL query patterns directly within Amazon Redshift, accelerating the query authoring process for users and reducing the time required to derive actionable data insights. Choose Query data.
For example, you can use metadata about the Kinesis data stream name to index by data stream ( ${getMetadata("kinesis_stream_name") ), or you can use document fields to index data depending on the CloudWatch log group or other document data ( ${path/to/field/in/document} ).
Instead, they rely on up-to-date dashboards that help them visualize data insights to make informed decisions quickly. Manually handling repetitive daily tasks at scale poses risks like delayed insights, miscataloged outputs, or broken dashboards. At a large volume, it would require around-the-clock staffing, straining budgets.
We’re excited to announce a new feature in Amazon DataZone that offers enhanced metadata governance for your subscription approval process. With this update, domain owners can define and enforce metadata requirements for data consumers when they request access to data assets. Key benefits The feature benefits multiple stakeholders.
Like any good puzzle, metadata management comes with a lot of complex variables. That’s why you need to use data dictionary tools, which can help organize your metadata into an archive that can be navigated with ease and from which you can derive good information to power informed decision-making. Download Now.
However, it wouldn’t be wise to display an excessive number of metrics on our monitoring dashboards because that could lead to less clarity and slower insights on the cluster. Capacity monitoring dashboards As part of our platform management process, we conduct monthly operational reviews to maintain optimal performance.
Metadata is at the heart of every report, dashboard, data warehouse, visualization, and anything else the BI team produces. Without an understanding of the organization’s metadata, the BI team can’t match the data from multiple sources to produce a single view of the business. Money Loser #1: Manual Data Discovery.
While BI outputs information through data visualization, online dashboards , and reporting, data warehouse outlines data in dimension and fact tables for upstream applications (or BI tools). In this context, the need for utilizing a proper tool, a stable business intelligence dashboard and data warehouse increased exponentially.
The CDH is used to create, discover, and consume data products through a central metadata catalog, while enforcing permission policies and tightly integrating data engineering, analytics, and machine learning services to streamline the user journey from data to insight.
As data-centric AI, automated metadata management and privacy-aware data sharing mature, the opportunity to embed data quality into the enterprises core has never been more significant. Data fabric Metadata-rich integration layer across distributed systems. Implementation complexity, relies on robust metadata management.
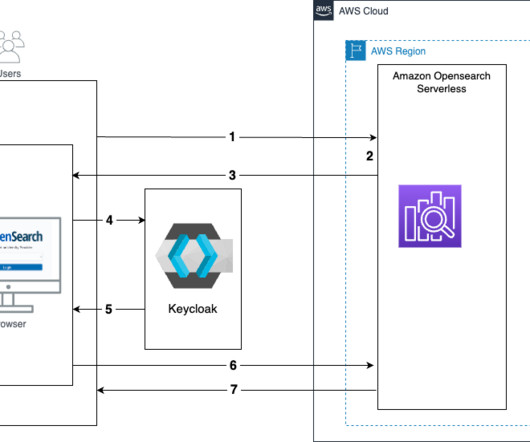
Amazon OpenSearch Serverless provides an installation of OpenSearch Dashboards with every collection created. This network access setting can be defined separately for the collection’s OpenSearch endpoint (used for data operations) and its corresponding OpenSearch Dashboards endpoint (used for visualizing and analyzing data).
Metadata and artifacts needed for audits: as an example, the output from the components of MLflow will be very pertinent for audits. A dashboard that provides custom views for all principals (operations, ML engineers, data scientists, business owners).
For example, dashboarding applications are a very common use case in Redshift customer environments where there is high concurrency and queries require quick, low-latency responses. First query response times for dashboard queries have significantly improved by optimizing code execution and reducing compilation overhead.
Key performance indicators (KPIs) of interest for a call center from a near-real-time platform could be calls waiting in the queue, highlighted in a performance dashboard within a few seconds of data ingestion from call center streams. The near-real-time insights can then be visualized as a performance dashboard using OpenSearch Dashboards.
The data engineer then emails the BI Team, who refreshes a Tableau dashboard. The delays impact delivery of the reports to senior management, who are responsible for making business decisions based on the dashboard. Imagine receiving a call from your CEO because sales on the CEO dashboard were off by a million dollars.
As quality issues are often highlighted with the use of dashboard software , the change manager plays an important role in the visualization of data quality. It involves: Reviewing data in detail Comparing and contrasting the data to its own metadata Running statistical models Data quality reports. 2 – Data profiling.
To build a strong least-privilege security posture, customers also wanted fine-grained access control to manage dashboard permission by user role. You can set up backend role mapping in OpenSearch Dashboards by group ID. Then you will log in as each user to verify the access control by looking at the different dashboard views.
Once you have accounted for all the CRM’s data, and metadata type, administrators will then need to take a comprehensive snapshot of the account,” added Mercer. There are several different metadata asset types that can end up being left behind because of configuration settings within CRMs,” added Fitzgerald. Visualize the problem.
In essence, a domain is an integrated data set and a set of views, reports, dashboards, and artifacts created from the data. The domain requires a team that creates/updates/runs the domain, and we can’t forget metadata: catalogs, lineage, test results, processing history, etc., ….
S3 Tables integration with the AWS Glue Data Catalog is in preview, allowing you to stream, query, and visualize dataincluding Amazon S3 Metadata tablesusing AWS analytics services such as Amazon Data Firehose , Amazon Athena , Amazon Redshift, Amazon EMR, and Amazon QuickSight. connection testing, metadata retrieval, and data preview.
Most of the time we think about data fields & files, columns & tables, reports & dashboards. Active metadata will play a critical role in automating such updates as they arise. If a language can include metadata in the form of comments (and they all can) then markup can be inserted. Why Focus on Lineage?
Business intelligence tools can include data warehousing, data visualizations, dashboards, and reporting. It comes with embedded dashboards privately and publicly. The best part about Tableau is the easy-to-use drag-and-drop user interface that makes it easy to create in-depth analysis and dashboards.
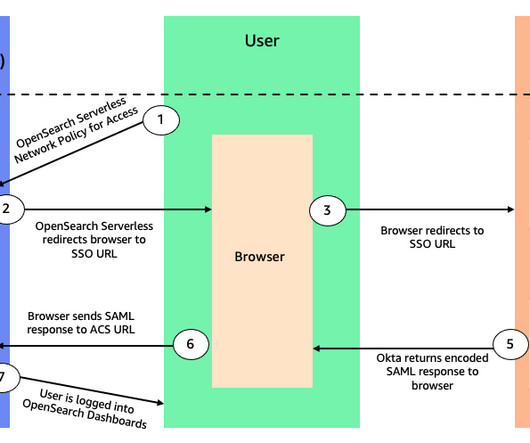
When you navigate to OpenSearch Dashboards, the workflow steps are as follows: OpenSearch Serverless generates a SAML authentication request. aoss.amazonaws.com/_saml/acs (replace with the corresponding Region) to generate the IdP metadata. Open a new tab and enter the copied metadata URL into your browser. Choose Edit.
Emission factor mapping and other capabilities As part of Oracle Fusion Cloud Sustainability, enterprises would get access to features such as automated transaction records, contextualized data, pre-built dashboards, emission factor mapping, and audit capabilities.
The CLEA dashboards were built on the foundation of the Well-Architected Lab. For more information on this foundation, refer to A Detailed Overview of the Cost Intelligence Dashboard. These ingested datasets are used as a source in CLEA dashboards. Data providers and consumers are the two fundamental users of a CDH dataset.
OpenSearch Service stores different types of stored objects, such as dashboards, visualizations, alerts, security roles, index templates, and more, within the domain. Open the Amazon OpenSearch Service dashboard using the OpenSearch Dashboards URL. amazonaws.com" }, "Action": "sts:AssumeRole" } ] } Make a note of the role ARN.
We will partition and format the server access logs with Amazon Web Services (AWS) Glue , a serverless data integration service, to generate a catalog for access logs and create dashboards for insights. Using Amazon Athena and Amazon QuickSight, we query and create dashboards for insights.
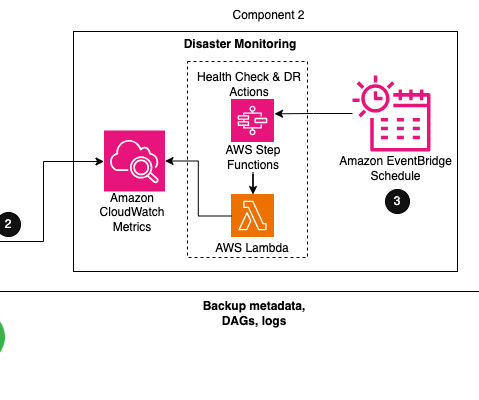
Within Airflow, the metadata database is a core component storing configuration variables, roles, permissions, and DAG run histories. A healthy metadata database is therefore critical for your Airflow environment. AWS publishes our most up-to-the-minute information on service availability on the Service Health Dashboard.
However, people generally don’t know which graphs, charts, or visualizations to ask for or how to discover initial data to prepare data for their dashboards. The solution responds to natural language text prompts to build dashboards and automated contextual summaries that help explore the data.
Content management systems: Content editors can search for assets or content using descriptive language without relying on extensive tagging or metadata. The system then offers them more precise solutions or forwards them to the appropriate support staff.
With OpenSearch Serverless, you can configure SAML to enable users to access data through OpenSearch Dashboards using an external SAML identity provider (IdP). In this post, we show you how to configure SAML authentication for OpenSearch Dashboards using IAM Identity Center as its IdP. application. Choose Next.
Save the federation metadata XML file You use the federation metadata file to configure the IAM IdP in a later step. In the Single sign-on section , under SAML Certificates , choose Download for Federation Metadata XML. Open the Amazon Redshift console and choose Provisioned clusters dashboard. Save this file locally.
Metadata and artifacts needed for a full audit trail. A dashboard that provides custom views for all principals (operations, ML engineers, data scientists, business owners). Versioning (of models, feature vectors , data) and the ability to roll out, roll back, or have multiple live versions.
The platform consists of approximately 370 dashboards, 360 tables registered in the data catalog, and 40 linked systems. Provide and keep up to date with technical metadata for loaded data. Configure business intelligence (BI) dashboards to provide data-driven insights to end-users targeted by the consumer’s project.
Data Governance/Catalog (Metadata management) Workflow – Alation, Collibra, Wikis. Dashboards show the status of tests across the data pipeline. . Data Science Workflow – Kubeflow, Python, R. Data Engineering Workflow – Airflow, ETL. Data Visualization, Preparation – Self-service tools sucha as Tableau, Alteryx.
Apache Iceberg is an open table format for very large analytic datasets, which captures metadata information on the state of datasets as they evolve and change over time. Apache Iceberg addresses customer needs by capturing rich metadata information about the dataset at the time the individual data files are created.
We organize all of the trending information in your field so you don't have to. Join 42,000+ users and stay up to date on the latest articles your peers are reading.
You know about us, now we want to get to know you!
Let's personalize your content
Let's get even more personalized
We recognize your account from another site in our network, please click 'Send Email' below to continue with verifying your account and setting a password.


Let's personalize your content