This site uses cookies to improve your experience. To help us insure we adhere to various privacy regulations, please select your country/region of residence. If you do not select a country, we will assume you are from the United States. Select your Cookie Settings or view our Privacy Policy and Terms of Use.
Cookie Settings
Cookies and similar technologies are used on this website for proper function of the website, for tracking performance analytics and for marketing purposes. We and some of our third-party providers may use cookie data for various purposes. Please review the cookie settings below and choose your preference.
Used for the proper function of the website
Used for monitoring website traffic and interactions
Cookie Settings
Cookies and similar technologies are used on this website for proper function of the website, for tracking performance analytics and for marketing purposes. We and some of our third-party providers may use cookie data for various purposes. Please review the cookie settings below and choose your preference.
Strictly Necessary: Used for the proper function of the website
Performance/Analytics: Used for monitoring website traffic and interactions
Understanding and tracking the right software delivery metrics is essential to inform strategic decisions that drive continuous improvement. When tied directly to strategic objectives, software delivery metrics become business enablers, not just technical KPIs. This alignment sets the stage for how we execute our transformation.
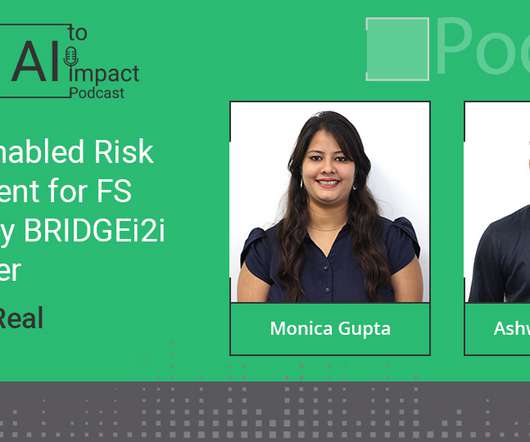
Episode 2: AI enabled RiskManagement for FS powered by BRIDGEi2i Watchtower. AI enabled RiskManagement for FS powered by BRIDGEi2i Watchtower. Today the Chief Risk Officers(CROs) struggle with the critical task of monitoring and assessing key risks in real time and firefight to mitigate any critical issues that arise.
Developers, data architects and data engineers can initiate change at the grassroots level from integrating sustainability metrics into data models to ensuring ESG data integrity and fostering collaboration with sustainability teams. However, embedding ESG into an enterprise data strategy doesnt have to start as a C-suite directive.
Solid reporting provides transparent, consistent and combined HR metrics essential for strategic planning, riskmanagement and the management of HR measures. It ensures that all relevant data and information is consolidated, evaluated and presented in a clear and concise form.
Amazon Redshift features like streaming ingestion, Amazon Aurora zero-ETL integration , and data sharing with AWS Data Exchange enable near-real-time processing for trade reporting, riskmanagement, and trade optimization. You can run a direct query from QuickSight for BI reporting and dashboards.
Improved riskmanagement: Another great benefit from implementing a strategy for BI is riskmanagement. For instance, BI dashboard software such as datapine offers the possibility to generate interactive dashboards in real-time without the need for any technical knowledge. click to enlarge**.
Rather, a security program should aim to achieve sufficient security and reduce risk to acceptable levels to achieve the organization’s overall business goals. To do so, the organization and the security program should define its security risk appetite. A risk appetite statement provides a high-level description of acceptable risk.
Insurance companies provide riskmanagement in the form of insurance contracts. Industry-specific, comprehensive, and reliable data management and presentation have become an issue of increasing concern in the insurance industry. The insurance dashboard is one of the most commonly used data display methods.
Thus, one tool that has gained significant popularity in recent years is the Project ManagementDashboard. Moreover, the implementation of an effective Project ManagementDashboard facilitates data-driven decision-making and sustainable business success. What Is A Project ManagementDashboard?
In a slightly more technically-driven role, a BI developer is responsible for building, creating, or improving BI-driven solutions that help analysts transform data into knowledge, including data dashboards. They often are senior professionals with a lot of knowledge and experience in BI and all the roles just mentioned. BI Data Scientist.
Riskmanagement. Here, project managers should summarize all predicted risks so that stakeholders can obtain a clear risk assessment and prepare plan B. Project Dashboard. A project dashboard offers a high-level view of the critical data about your project’s current status. Free Download.
Implementing a modern data architecture makes it possible for financial institutions to break down legacy data silos, simplifying data management, governance, and integration — and driving down costs. However, because most institutions lack a modern data architecture , they struggle to manage, integrate and analyze financial data at pace.
” European Parliament News The EU AI Act in brief The primary focus of the EU AI Act is to strengthen regulatory compliance in the areas of riskmanagement, data protection, quality management systems, transparency, human oversight, accuracy, robustness and cyber security.
Data scientists need to understand the business problem and the project scope to assess feasibility, set expectations, define metrics, and design project blueprints. Outline clear metrics to measure success. Document assumptions and risks to develop a riskmanagement strategy. Define project scope.
They also put together custom database queries to answer the questions of business users, implement new metrics from existing data, strive to improve data quality, and contribute to correct acquisition of new data. This includes database modeling, metrics definition, dashboard design , and creating and publishing executive reports.
The dashboard produces a collection of infographics that make it possible to study each microservice or API and determine just how much it costs to keep it running in times of high demand and low. Ideally, teams will be able to control their own costs and predict future usage with the reports and dashboards on offer.
A continuous vulnerability management process helps stop cyberattacks—and soften the blow of those that succeed—by finding and fixing flaws before threat actors can weaponize them. The vulnerability management lifecycle Corporate networks are not static.
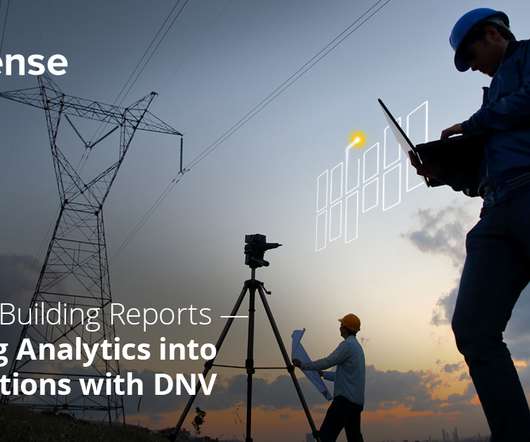
In this article, we’ll look at how DNV took intelligence from its massive datasets and put the right bits of information into its platforms in the right way (not simply embedding reports and dashboards) to drive impact for its users. DNV is an independent expert in riskmanagement and assurance, operating in more than 100 countries.
As threat landscapes become increasingly more severe, managing human risk is critical to the success of the security program in any organization. Dashboards built in QuickSight empower stakeholders to quickly visualize what areas may need added attention by way of training intervention or updated policy.
Riskmanagement IBP facilitates proactive riskmanagement by considering various scenarios and identifying potential risks and opportunities. By analyzing data and conducting what-if analyses, companies can develop contingency plans and mitigate risks before they materialize.
Clearly define the objective of the implementation project and determine its scope, timeline and budget as well as create a riskmanagement plan. This phase of planning also covers projected project milestones and well-defined metrics for the system once it goes live.
Through interactive dashboards , these tools empower users across various departments to access and interpret data effectively. Evaluating the range of visualizations offered, such as interactive dashboards, charts, and graphs, is vital for determining the tool’s effectiveness in conveying insights.
They can improve data quality, security and riskmanagement without the need for an expensive big-bang project. A Stewardship Dashboard streamlines governance activities like curation. This is a powerful means of aligning business and data teams around strategy and success metrics—which is critical for a data culture.
By using this model, all accuracy metrics would also comply with national valuation regulations —as defined by the Bank of Spain. They could also assess new locations for either investment or real estate development as well as building their own reporting dashboards. Consume Results with DataRobot AI Applications.
Value Management or monetization. RiskManagement (most likely within context of governance). Product Management. Remember, it’s not about how many records were cleaned up or how many dashboards were generated, it’s about how much of an impact on the outcome the worm of D&A has that counts. Governance.
Emphasizes governance and riskmanagement similar to the EU AI Act and Canadas Bill C-27. Transparency & Explainability Model-Agnostic Explanation Service an explanation service is called immediately after a prediction is made to generate a human-readable explanation that can be surfaced via dashboards or logs.
A Tax Key Performance Indicator (KPI) or metric is a clearly defined quantifiable measure that an organization, or business, uses to measure the success of its Tax Function over time. Since every organization has its own manner of operation, the KPIs or metrics used for tax will vary from one organization to another.
Executive Dashboards and Reports in Five Minutes. management satisfaction. Compliance RiskManagement. Also known as integrity risk, compliance riskmanagement can help your company navigate properly through the hoops of your industry’s laws and regulations. Give Your Metrics Context.
And with that understanding, you’ll be able to tap into the potential of data analysis to create strategic advantages, exploit your metrics to shape them into stunning business dashboards , and identify new opportunities or at least participate in the process. Product/market fit is THE most important factor to get right.
Because it is either too complicated or time-consuming to track key financial metrics, accounting teams may fall into the trap of checking KPIs occasionally and operating the rest of the time largely on assumptions and intuition. It also has implications for riskmanagement; lots of small policies are less risky than a few large policies.
Solutions like AWS Pipeline from Amazon and Logi Symphony from insightsoftware leverage automation and user-friendly dashboards to help ensure that datasets are available in the right format, at the right time, and in the right place for decision-making and analysis. The pipeline should be monitored to ensure it runs smoothly and efficiently.
Thanks to automation, it is entirely possible to work as an accountant for your entire career without ever manually performing a reconciliation or monitoring relevant metrics during a financial close. With the rise of financial reporting software , many finance professionals rely on automated reconciliation for this vital process.
Information riskmanagement is no longer a checkpoint at the end of development but must be woven throughout the entire software delivery lifecycle. The evolution of riskmanagement Modern information security requires thinking like a trusted advisor rather than a checkpoint guardian.
They will not see any impact on the doctor’s prescription, as they are tracking the wrong metrics. This proactive approach helps managerisks and enhances the organisation’s overall financial health and stability. Revenue per available room (RevPAR) is an operational KPI and a vital financial metric.
Enhanced Reporting and Dashboards Analytics is no longer a luxury for finance teamsits a necessity. EPM bridges this skills gap with advanced analytics, real-time dashboards, and interactive reporting. EPM systems simplify riskmanagement and compliance by automating tasks like monitoring and reporting.
We organize all of the trending information in your field so you don't have to. Join 42,000+ users and stay up to date on the latest articles your peers are reading.
You know about us, now we want to get to know you!
Let's personalize your content
Let's get even more personalized
We recognize your account from another site in our network, please click 'Send Email' below to continue with verifying your account and setting a password.


Let's personalize your content