This site uses cookies to improve your experience. To help us insure we adhere to various privacy regulations, please select your country/region of residence. If you do not select a country, we will assume you are from the United States. Select your Cookie Settings or view our Privacy Policy and Terms of Use.
Cookie Settings
Cookies and similar technologies are used on this website for proper function of the website, for tracking performance analytics and for marketing purposes. We and some of our third-party providers may use cookie data for various purposes. Please review the cookie settings below and choose your preference.
Used for the proper function of the website
Used for monitoring website traffic and interactions
Cookie Settings
Cookies and similar technologies are used on this website for proper function of the website, for tracking performance analytics and for marketing purposes. We and some of our third-party providers may use cookie data for various purposes. Please review the cookie settings below and choose your preference.
Strictly Necessary: Used for the proper function of the website
Performance/Analytics: Used for monitoring website traffic and interactions
Tableau Desktop then presents this data to tell a story, while Tableau Server allows you to share these visuals with the intended audience. […] The post How to Integrate Google Gemini into Tableau Dashboards? appeared first on Analytics Vidhya.
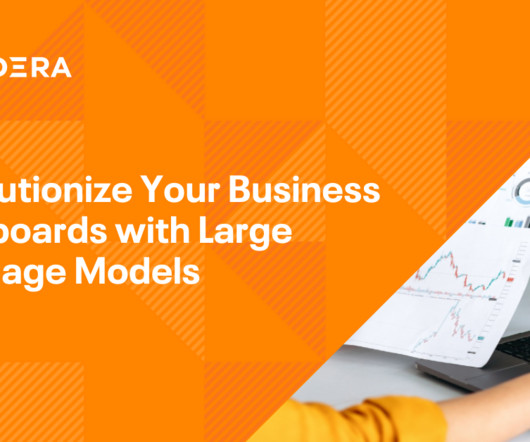
This is where the power of business dashboards comes into play. Dashboards often are the best way to gain insight into an organization and its various departments, operations and performance. Well-built, focused dashboards easily serve up summaries and reports of the BI that’s most critical to the organization.
Overview Qlik is widely associated with powerful dashboards and business intelligence reports Did you know that you can use the power of Qlik to. The post Build your First Linear Regression Model in Qlik Sense appeared first on Analytics Vidhya.
But today, dashboards and visualizations have become table stakes. Think your customers will pay more for data visualizations in your application? Five years ago they may have. Discover which features will differentiate your application and maximize the ROI of your embedded analytics. Brought to you by Logi Analytics.
A look at the landscape of tools for building and deploying robust, production-ready machine learning models. We are also beginning to see researchers share sample code written in popular open source libraries, and some even share pre-trained models. Model development. Model governance. Source: Ben Lorica.
A customer retention dashboard and metrics depicted in a neat visual will help you in monitoring, analyzing, and managing multiple customer-centric points and how they echo in your business. Your Chance: Want to build a dashboard for customer retention? Try our professional dashboard software for 14 days, completely free!
What is equally important here is the ability to communicate the data and insights from your predictive models through reports and dashboards. Introduction In this article, we will explore one of Microsoft’s proprietary products, “PowerBI”, in-depth. PowerBI is used for Business intelligence. And […].
Model packaging: companies are using MLflow to incorporate custom logic and dependencies as part of a model’s package abstraction before deploying it to their production environment (example: a recommendation system might be programmed to not display certain images to minors). Model governance. there aren’t enough of them.
1) What Is A Small Business Dashboard? 3) Why Do You Need Small Business Dashboards. 4) Small Business Dashboard & KPIs Examples. Enter small business dashboards and metrics. BI dashboard tools provide smaller businesses with valuable insights regarding their operations thanks to real-time access to data.
Bigeye’s monitoring capabilities start with automated dependency mapping to identify the source of data used in analytic dashboards and data products, as well as a lineage graph of the data pipeline. The ability to monitor and measure improvements in data quality relies on instrumentation.
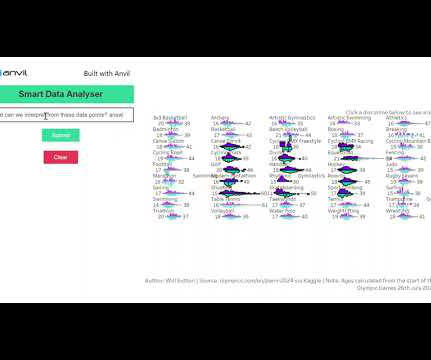
In today’s data-driven world, businesses rely heavily on their dashboards to make informed decisions. However, traditional dashboards often lack the intuitive interface needed to truly harness the power of data. Say goodbye to static dashboards and hello to a whole new level of engagement.
Power BI interviews will provide insights from a variety of data by modelling data and telling stories from data visualizations using reports and dashboards. Introduction Power BI is one of the most popular data visualization and analytics software product developed by Microsoft. Source: [link] […].
Spreadsheets finally took a backseat to actionable and insightful data visualizations and interactive business dashboards. The predictive models, in practice, use mathematical models to predict future happenings, in other words, forecast engines. Data exploded and became big. We all gained access to the cloud.
The hype around large language models (LLMs) is undeniable. Think about it: LLMs like GPT-3 are incredibly complex deep learning models trained on massive datasets. Tableau, Qlik and Power BI can handle interactive dashboards and visualizations. They leverage around 15 different models. Theyre impressive, no doubt.
The Cybersecurity Maturity Model Certification (CMMC) serves a vital purpose in that it protects the Department of Defense’s data. Myrddin is now part of our CMMC dashboard tool that assists users in conducting gap assessments and interpreting cybersecurity compliance guidelines,” says Birmingham. “It
In the following section, two use cases demonstrate how the data mesh is established with Amazon DataZone to better facilitate machine learning for an IoT-based digital twin and BI dashboards and reporting using Tableau. The applications are hosted in dedicated AWS accounts and require a BI dashboard and reporting services based on Tableau.
“This process involves connecting AI models with observable actions, leveraging data subsequently fed back into the system to complete the feedback loop,” Schumacher said. Most AI hype has focused on large language models (LLMs).
Today, there are online data visualization tools that make it easy and fast to build powerful market-centric research dashboards. How To Present Your Results: 3 Market Research Example Dashboards. When it comes to sharing the most important information, research dashboards are invaluable. Let’s take a closer look.
Building Models. A common task for a data scientist is to build a predictive model. You’ll try this with a few other algorithms, and their respective tuning parameters–maybe even break out TensorFlow to build a custom neural net along the way–and the winning model will be the one that heads to production.
If you ask an engineer to show how they operate the application in production, they will likely show containers and operational dashboards—not unlike any other software service. Not only is data larger, but models—deep learning models in particular—are much larger than before.
Data visualizations put together in intuitive dashboards can make the analysis process more dynamic and understandable while keeping the audience engaged. The principles of color theory will have a notable impact on the overall success of your visualization model. Gauge charts can be effectively used with a single value or data point.
Organizations face various challenges with analytics and business intelligence processes, including data curation and modeling across disparate sources and data warehouses, maintaining data quality and ensuring security and governance.
In a world focused on buzzword-driven models and algorithms, you’d be forgiven for forgetting about the unreasonable importance of data preparation and quality: your models are only as good as the data you feed them. If you’re basing business decisions on dashboards or the results of online experiments, you need to have the right data.
While some experts try to underline that BA focuses, also, on predictive modeling and advanced statistics to evaluate what will happen in the future, BI is more focused on the present moment of data, making the decision based on current insights. Asking the right business intelligence questions will lead you to better analytics.
Generative artificial intelligence ( genAI ) and in particular large language models ( LLMs ) are changing the way companies develop and deliver software. The commodity effect of LLMs over specialized ML models One of the most notable transformations generative AI has brought to IT is the democratization of AI capabilities.
However, it wouldn’t be wise to display an excessive number of metrics on our monitoring dashboards because that could lead to less clarity and slower insights on the cluster. Capacity monitoring dashboards As part of our platform management process, we conduct monthly operational reviews to maintain optimal performance.
It’s necessary to say that these processes are recurrent and require continuous evolution of reports, online data visualization , dashboards, and new functionalities to adapt current processes and develop new ones. In the traditional model communication between developers and business users is not a priority. Data changes.
Furthermore, the introduction of AI and ML models hastened the need to be more efficient and effective in deploying new technologies. Similarly, Workiva was driven to DataOps due to an increased need for analytics agility to meet a range of organizational needs, such as real-time dashboard updates or ML model training and monitoring.
c) Dashboard Features. Business intelligence tools provide you with interactive BI dashboards that serve as powerful communication tools to keep teams engaged and connected. 3) Dashboards. Here you will find some of the main BI tool features related to dashboard management: a) Built-in dashboard templates.
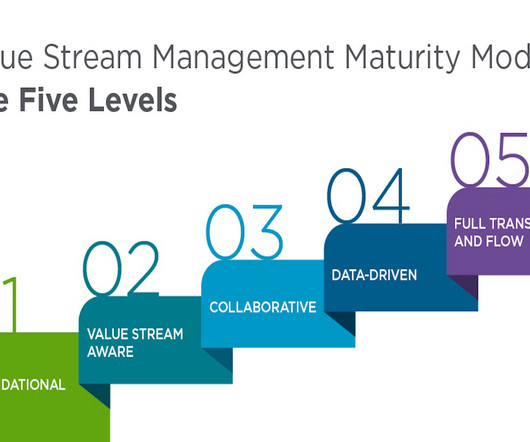
Recognizing this need, we have created a cutting-edge VSM maturity model. Drawing upon our extensive experience facilitating successful VSM initiatives within large-scale enterprises, this model serves as a compass, offering insights into their current VSM maturity and providing practical direction to advance and reap the additional benefits.
However, while Cloudera, Hortonworks, and MapR worked well for a set of common data engineering workloads, they didn’t generalize well to workloads that didn’t fit the MapReduce paradigm, including deep learning and new natural language models. Let’s dive into these reasons in more depth. Data Science and Machine Learning Require Flexibility.
They achieve this through models, patterns, and peer review taking complex challenges and breaking them down into understandable components that stakeholders can grasp and discuss. This comprehensive model helps architects become true enablers of organizational success. Most importantly, architects make difficult problems manageable.
Companies successfully adopt machine learning either by building on existing data products and services, or by modernizing existing models and algorithms. For example, in a July 2018 survey that drew more than 11,000 respondents, we found strong engagement among companies: 51% stated they already had machine learning models in production.
The pipelines and workflows that ingest data, process it and output charts, dashboards, or other analytics resemble a production pipeline. When analytics and dashboards are inaccurate, business leaders may not be able to solve problems and pursue opportunities. Figure 1: The four phases of Lean DataOps. Production DataOps. Data Errors.
Turning these datasets into a business dashboard can effectively track the right values and offer a comprehensive application to the entire business system. The CPC (cost-per-click) overview of campaigns is an operational metric that expounds on the standard pricing model in online advertising. Let’s see this through an example.
Instead of writing code with hard-coded algorithms and rules that always behave in a predictable manner, ML engineers collect a large number of examples of input and output pairs and use them as training data for their models. The model is produced by code, but it isn’t code; it’s an artifact of the code and the training data.
That said, we will go into details of a marketing campaign report, provide a digital marketing report template, and look into marketing reporting and analysis with the help of carefully created dashboards. It shows how targets are performing in a monthly view, but the user can easily set this marketing dashboard to a yearly time frame.
In recent posts, we described requisite foundational technologies needed to sustain machine learning practices within organizations, and specialized tools for model development, model governance, and model operations/testing/monitoring. Sources of model risk. Model risk management. Image by Ben Lorica.
DataOps needs a directed graph-based workflow that contains all the data access, integration, model and visualization steps in the data analytic production process. Naveego — A simple, cloud-based platform that allows you to deliver accurate dashboards by taking a bottom-up approach to data quality and exception management.
To unlock the full potential of AI, however, businesses need to deploy models and AI applications at scale, in real-time, and with low latency and high throughput. The Cloudera AI Inference service is a highly scalable, secure, and high-performance deployment environment for serving production AI models and related applications.
Business analysts sometimes perform data science, but usually, they integrate and visualize data and create reports and dashboards from data supplied by other groups. They see the data errors , the production errors, the broken reports and the inaccurate dashboards. The work product could be a chart, graph, model or dashboard.
SaaS is a software distribution model that offers a lot of agility and cost-effectiveness for companies, which is why it’s such a reliable option for numerous business models and industries. Flexible payment options: Businesses don’t have to go through the expense of purchasing software and hardware. 6) Micro-SaaS.
These strategies, such as investing in AI-powered cleansing tools and adopting federated governance models, not only address the current data quality challenges but also pave the way for improved decision-making, operational efficiency and customer satisfaction. When customer records are duplicated or incomplete, personalization fails.
We organize all of the trending information in your field so you don't have to. Join 42,000+ users and stay up to date on the latest articles your peers are reading.
You know about us, now we want to get to know you!
Let's personalize your content
Let's get even more personalized
We recognize your account from another site in our network, please click 'Send Email' below to continue with verifying your account and setting a password.


Let's personalize your content