This site uses cookies to improve your experience. To help us insure we adhere to various privacy regulations, please select your country/region of residence. If you do not select a country, we will assume you are from the United States. Select your Cookie Settings or view our Privacy Policy and Terms of Use.
Cookie Settings
Cookies and similar technologies are used on this website for proper function of the website, for tracking performance analytics and for marketing purposes. We and some of our third-party providers may use cookie data for various purposes. Please review the cookie settings below and choose your preference.
Used for the proper function of the website
Used for monitoring website traffic and interactions
Cookie Settings
Cookies and similar technologies are used on this website for proper function of the website, for tracking performance analytics and for marketing purposes. We and some of our third-party providers may use cookie data for various purposes. Please review the cookie settings below and choose your preference.
Strictly Necessary: Used for the proper function of the website
Performance/Analytics: Used for monitoring website traffic and interactions
With a powerful dashboard maker , each point of your customer relations can be optimized to maximize your performance while bringing various additional benefits to the picture. Your Chance: Want to build professional CRM reports & dashboards? Your Chance: Want to build professional CRM reports & dashboards?
The answer is modern agency analytics reports and interactive dashboards. Starting with its definition, following with the benefits of agency reports, a list of tools, and a set of agency dashboard examples. We will then finish with 8 valuable tips to achieve a successful agency reporting process.
Enter data dashboards – one of history’s best innovations in business intelligence. To help you understand this notion in full, we’re going to explore a data dashboard definition, explain the power of dashboard data, and explore a selection of data dashboard examples. What Is A Data Dashboard? click to enlarge**.
And the best way to do so is by using digital dashboards and a modern online reporting tool. But before we go any further, let’s consider what a call center report is and what it does. What Is A Call Center Dashboard? Your Chance: Want to test a call center dashboard software for free? We offer a 14-day free trial.
But today, dashboards and visualizations have become table stakes. Think your customers will pay more for data visualizations in your application? Five years ago they may have. Discover which features will differentiate your application and maximize the ROI of your embedded analytics. Brought to you by Logi Analytics.
Exclusive Bonus Content: Reap the benefits of dashboards for CEOs! CEO dashboards and CEO reports are the answer. By leveraging the power of an online dashboard , an executive story can be written effortlessly, and within minutes. What Is A CEO Dashboard? Mobility through 24/7 mobile dashboard access.
Table of Contents 1) What Are White Label Reports? 2) Benefits Of White Label Reports 3) Key White Label Reporting Features 4) White Label Dashboards & Report Examples In today’s competitive business environment, building a brand that is trusted, recognizable, and loved by many is not an easy task.
1) What Is Content Reporting? 2) What Is A Content Dashboard? 3) Why Is Content Report Analysis Important? 4) Content Dashboards Examples. 5) Content Reporting Best Practices. Enter modern content reports. What Is Content Reporting? What Is A Content Dashboard? Table of Contents.
An important part of a successful business strategy is utilizing a modern data analysis tool and implementing a marketing report in its core procedures that will become the beating heart of acquiring customers, researching the market, providing detailed data insights into the most valuable information for any business: is our performance on track?
In its 2020 Embedded BI Market Study, Dresner Advisory Services continues to identify the importance of embedded analytics in technologies and initiatives strategic to business intelligence. Discover the top seven requirements to consider when evaluating your embedded dashboards and reports.
Also, implementing effective management reports will create a data-driven approach to making business decisions and obtaining sustainable business success. Here, we explain the fundamental dynamics of project dashboard software, explore the benefits of project dashboards, and ask the question: what is a project dashboard?
That said, if you’re looking to evolve your empire, increase brand awareness, and boost your bottom line, embracing business performance dashboards and big data should be at the top of your priority list. You need data-driven decisions, and a dashboard for business performance will make sure you reap the best possible rewards.
As a business, you need the reliability of frequent financial reports to gain a better grasp of your financial status, both current and future. A robust finance report communicates crucial financial information that covers a specified period through daily, weekly, and monthly financial reports. What Is A Finance Report?
A chief technology officer (also referred to as chief technical officer or chief technologist), has an immense responsibility to drive a company forward and lead the technological advancements, research, development, and management in order to generate business value and increase the return on investment (ROI). What Is A CTO Report?
Introduction Organizations are turning to cloud-based technology for efficient data collecting, reporting, and analysis in today’s fast-changing business environment. Reports, dashboards, and analytics tools are used by business users to derive insights […].
By utilizing recruiting KPIs presented through the medium of visual and interactive HR dashboards , it’s possible to use recruitment metrics to better interpret and evaluate a variety of talent acquisition factors that aid in hiring processes. Exclusive Bonus Content: What are recruiting metrics & dashboards for?
Before we even realize our business potentials and want to act in our competitive market, there is always a new business plan to make, a new strategy to develop, a new report to generate – and they all take time. Your Chance: Want to test a professional reporting automation software? What Is An Automated Report?
Here, we’ll look at what a Salesforce report is, explore working Salesforce report examples, and consider how to unlock extra value by exploring the platform’s data with professional Salesforce dashboards created with powerful reporting tools. Exclusive Bonus Content: Your Definitive Guide to Salesforce Reports!
In this post, we’re going to give you the 10 IT & technology buzzwords you won’t be able to avoid in 2020 so that you can stay poised to take advantage of market opportunities and new conversations alike. Exclusive Bonus Content: Download our Top 10 Technology Buzzwords! Artificial Intelligence (AI).
Rapid technological evolution means it’s now possible to use accessible and intuitive data-driven tools to our advantage. For hospitals, hospices, medical centers, homecare operators, and palliative care professionals looking to improve operational efficiency, producing and working with a healthcare report is the answer.
As in many other industries, the information technology sector faces the age-old issue of producing IT reports that boost success by helping to maximize value from a tidal wave of digital data. Get our summary to learn the key elements and benefits of IT reporting! What Are IT Reports? Why Do You Need An IT Report?
In the Age of Information, digital technologies have evolved to such an extent that a wealth of tools, applications, and platforms exists to enhance the way businesses operate in a number of areas. That’s where SaaS dashboards enter the fold. Exclusive Bonus Content: Your Definitive Guide to SaaS & Dashboards!
Digital dashboards not only help you to drill down into the insights that matter most to your business, but they also offer an interactive visual representation that assists in swifter, more informed decision-making as well as the discovery of priceless new insights. Your Chance: Want to build your own digital dashboard with a few clicks?
Getting your socially-driven affairs in order can seem like an impossible feat, but with social media reporting, you will be able to gain the insights you need to attain the results you deserve. When you add up modern technology and a professional report tool , your reporting processes in the social realm will reap many rewards.
Table of Contents 1) What Is The Report Definition? 2) Top 14 Types Of Reports 3) What Does A Report Look Like? Businesses have been producing reports since, forever. This presents a problem for many modern organizations today as building reports can take from hours to days. What Is The Report Definition?
A business intelligence dashboard coupled with a dynamic dashboard display will allow you to squeeze every last drop of value from the insights that matter most. But before we delve any deeper, let’s consider the definition of this kind of a dashboard and its role in the modern workplace. What Is A TV Dashboard?
Whatever your sector or niche, if you want to remain adaptable and get one step ahead of the competition, working with the right data-driven tools and utilizing a corporate dashboard is essential. That’s where corporate dashboards come in. Your Chance: Want to create your own dynamic corporate dashboard? 1) CFO dashboard.
BI projects aren’t just for the big fishes in the sea anymore; the technology has developed rapidly, the software has become more accessible while business intelligence and analytics projects implemented in various industries regularly, no matter the shape and size, small businesses or large enterprises. Concentrate on technicalities.
By combining the art of storytelling with the technological capabilities of dashboard software , it’s possible to develop powerful, meaningful, data-backed presentations that not only move people but also inspire them to take action or make informed, data-driven decisions that will benefit your business. What Is Dashboard Storytelling?
3) The Role Of Data Drilling In Reporting. 4) Drill Down & Drill Through Reporting Examples. From automated reporting, predictive analytics, and interactive data visualizations, reporting on data has never been easier. Your Chance: Want to start building your own interactive reports today? Table of Contents.
And procurement reporting is no exception to this. In this article, we will explain the basic definition of procurement reports, talk about the benefits and challenges that occur when dealing with procurement data to provide you with innovative ideas on spotting inefficiencies. What Are Procurement Reports?
Approaches to communication are changing, and success in today’s technology-driven world correlates directly to the quantity rather than the quality of one’s information—metrics relating to the business, the client, the competitor, and the market. An online BI dashboard. Exclusive Bonus Content: Download Our Free Dashboard Checklist!
Technology evolves, the industry changes and the way businesses use technology changes. The road that has brought us to the current state of reporting capabilities in the Microsoft data platform has been long and winding.
1) What Is A Small Business Dashboard? 3) Why Do You Need Small Business Dashboards. 4) Small Business Dashboard & KPIs Examples. Enter small business dashboards and metrics. BI dashboard tools provide smaller businesses with valuable insights regarding their operations thanks to real-time access to data.
Bigeye was founded in late 2018 by Chief Executive Officer Kyle Kirwan and Chief Technology Officer Egor Gryaznov. However, only 16% of participants in ISG’s Data Governance Benchmark Research report that data is well trusted in their organization. Enterprises Having trust in data is crucial to business decision-making.
Marketers need to rely heavily on big data technology to reach customers more effectively. Big data technology isn’t just important for making better insights. Visual marketing dashboards are prime examples of using big data effectively in marketing. It acts the same as a car’s dashboard.
Second, decision-makers increasingly rely on genAI to … ask questions about their financial and operational data without relying on traditional dashboards and reports,” said Greenstein.” Lazarev agrees: “It’s one thing to have the technology, but it’s another to weave it into the fabric of your business strategy.
If you want to convey crucial information to decision-makers in the easiest and most effective way possible, you need to embrace the power of interactive dashboards. A business dashboard offers at-a-glance insights based on key performance indicators (KPIs) and is an intuitive and visually pleasing way to consume data.
And part of that success comes from investing in talented IT pros who have the skills necessary to work with your organizations preferred technology platforms, from the database to the cloud. The software is used for data analytics, importing data, manipulating data, data modeling, and building data visualizations and reports.
In my past perspectives, I’ve written about the evolution from data at rest to data in motion and the fact that you can’t rely on dashboards for real-time analytics. If organizations can’t rely on dashboards for real-time analytics, what should they consider? As well, analytics are becoming more and more intertwined with operations.
Business intelligence concepts refer to the usage of digital computing technologies in the form of data warehouses, analytics and visualization with the aim of identifying and analyzing essential business-based data to generate new, actionable corporate insights. Data dashboarding and reporting. The data warehouse.
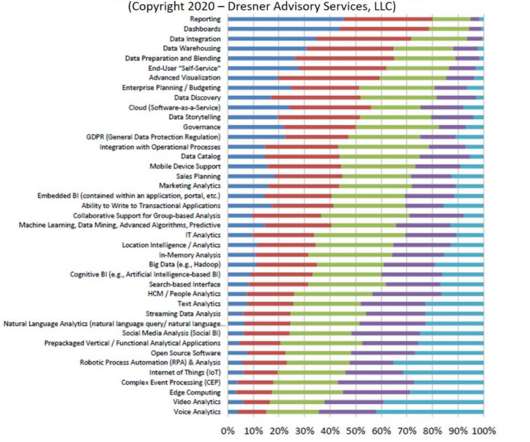
Dresner Advisory Services’ report about self-service business intelligence uncovered a surprising result. Among all the technologies and initiatives that respondents consider important, the item that topped the list was reporting. But seriously, reporting? How can you not think of "TPS Reports"? Let that sink in.
c) Dashboard Features. d) Reporting Features. Business intelligence tools provide you with interactive BI dashboards that serve as powerful communication tools to keep teams engaged and connected. Table of Contents. 1) Benefits Of Business Intelligence Software. 2) Top Business Intelligence Features. b) Analytics Features.
They can also automate report generation and interpret data nuances that traditional methods might miss. Tableau, Qlik and Power BI can handle interactive dashboards and visualizations. Typically, the initial excitement about the latest and greatest technology can blind us to practical considerations. And guess what?
We organize all of the trending information in your field so you don't have to. Join 42,000+ users and stay up to date on the latest articles your peers are reading.
You know about us, now we want to get to know you!
Let's personalize your content
Let's get even more personalized
We recognize your account from another site in our network, please click 'Send Email' below to continue with verifying your account and setting a password.


Let's personalize your content