This site uses cookies to improve your experience. To help us insure we adhere to various privacy regulations, please select your country/region of residence. If you do not select a country, we will assume you are from the United States. Select your Cookie Settings or view our Privacy Policy and Terms of Use.
Cookie Settings
Cookies and similar technologies are used on this website for proper function of the website, for tracking performance analytics and for marketing purposes. We and some of our third-party providers may use cookie data for various purposes. Please review the cookie settings below and choose your preference.
Used for the proper function of the website
Used for monitoring website traffic and interactions
Cookie Settings
Cookies and similar technologies are used on this website for proper function of the website, for tracking performance analytics and for marketing purposes. We and some of our third-party providers may use cookie data for various purposes. Please review the cookie settings below and choose your preference.
Strictly Necessary: Used for the proper function of the website
Performance/Analytics: Used for monitoring website traffic and interactions
Viole Kastrati: Without systematic and continuous reporting, it is almost impossible to get a complete picture of the personnel situation and make informed decisions based on it. This is due, on the one hand, to the uncertainty associated with handling confidential, sensitive data and, on the other hand, to a number of structural problems.
Although Microsoft’s rollout of its two ERP cloud products (D365 F&SCM, and for smaller businesses, D365 Business Central) has been going on for some time, the current climate of economic uncertainty has prompted a lot of companies to hit the pause button on migration, choosing instead to stay the course with their existing Dynamics AX systems.
With advanced analytics, flexible dashboarding and effective data visualization, FP&A storytelling has become both an art and science. Dashboards and analytics have been around for a long, long time. First, because uncertainty exploded. I’ve worked with hundreds of dashboard and data visualization projects over the years.
A DSS supports the management, operations, and planning levels of an organization in making better decisions by assessing the significance of uncertainties and the tradeoffs involved in making one decision over another. ERP dashboards. Dashboards and other user interfaces that allow users to interact with and view results.
Bridging the Gap: How ‘Data in Place’ and ‘Data in Use’ Define Complete Data Observability In a world where 97% of data engineers report burnout and crisis mode seems to be the default setting for data teams, a Zen-like calm feels like an unattainable dream. One of the primary sources of tension?
We chose Amazon QuickSight because it gave us dynamic and interactive dashboards embedded in our application, while saving us money and development time. Modernized analytics and reporting At iostudio, we faced the challenge of modernizing our government client’s static recruitment marketing analytics solution.
Deal furthers mission to deliver powerful portfolio of enterprise software solutions for Office of the CFO; expands real-time financial reporting capabilities for top ERPs Sage and Viewpoint. Emphasis on accurate financial and operational reporting in order to maintain cash flow is more important than ever. RALEIGH, N.C.
The term ‘operational finance’ encapsulates the critical activities associated with order to cash, procure to pay, fixed assets, close, consolidation, and reporting. By finely tuning its AR reporting capabilities, a business can enjoy greater financial stability and predictability – something much needed in the current climate.
Recognizing a need for better operational analytics, insightsoftware leveraged award-winning technology from Logi Analytics to provide Oracle ERP Cloud users the ability to customize, create, and share interactive dashboards and reports across all departments of a business.
That’s not surprising, given the uncertainty of the current global economic climate. Executive dashboard linked to ERP and CRM. If you are looking to address a specific need such as e-commerce or executive dashboards, these kinds of third-party enhancements can provide significant value for the money.
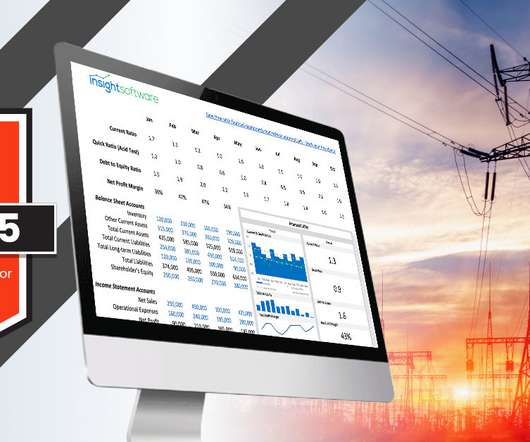
Utility companies will need to report and monitor their KPIs obsessively to understand how these new approaches to energy are positively and negatively affecting their financial performance. COVID-19 introduces another level of uncertainty. Download our free Debt-to-Equity Ratio sample dashboard template.
We now hear terms like enterprise performance management (EPM), which covers a broad spectrum of functions, including budgeting, forecasting, reporting, consolidation, analytics, and dashboarding. Changing economic conditions and shifting government priorities provide grounds for further uncertainty.
Those investments come just as the company claims, in its 2023 annual report, that demand from corporate data centers in the US is expected to roughly double within the next three years as generative AI deployments expand. But with the addition of more renewable energy to its portfolio, weather uncertainty becomes a greater challenge for AES.
With the economy pushing companies to do more with less, new research underscores the case for automated reporting RALEIGH, N.C. April 12, 2023 – insightsoftware , a global provider of reporting, analytics, and performance management solutions, today released new research on the state of operational reporting.
Such approaches are gaining popularity as economic uncertainty and volatility are prevalent. It can be difficult to increase the frequency of those processes due to the overhead involved with gathering and reporting information, soliciting input from stakeholders, and compiling revisions to the forecasts and the budget plan.
As organizations face macroeconomic uncertainty and rapid changes to market conditions, collaboration between IT and business units are crucial to making those transitions quickly and smoothly. Data showed the company wasn’t closing expected orders, which was showing up as lost revenue in quarterly reports, Sabhlok says.
According to the Geophysical Fluid Dynamics Laboratory of the US’s National Oceanic and Atmospheric Association (NOAA), “Climate models reduce the uncertainty of climate change impacts, which aids in adaptation.” 3 Climate Science Special Report: Fourth National Climate Assessment, Volume I. degrees Celsius (2.66
In this episode of AI to Impact, Jitendra Jethanandani, Director, Enterprise Tech at BRIDGEi2i, discusses how the current COVID-19 pandemic spreads waves of uncertainty across businesses and their customer base requiring a renewed focus required on customer engagement. COVID-19 and Changing Facets of Customer Engagement. JJ: Yes, Anushruti.
Inaccurate Reporting. While this can be avoided with a strict set of rules and backups in place, it still causes a lot of complication and uncertainty to those involved in planning and management. Jet Global specializes in providing reporting, analytics, and budgeting solutions for Microsoft Dynamics ERP customers. No more risk.
Now is the time to apply the full force of business intelligence used by analytics teams to help navigate growing uncertainty. With smart dashboards and KPIs , the BraunAbility team is able to tie discount data from marketing platforms to sales results in order to more effectively measure the impact of any discount.
In a research brief defining “5 trends for 2023,” the IBM Institute for Business Value reports, “In 2023, rapid response is the new baseline. Uncertainty is expected and complexity is compounding. As threats materialize on multiple fronts, organizations must reduce the time from insight to action.”
The business oracles at Gartner recently released a list of nine traits necessary for CFOs to preserve performance throughout periods of crisis and uncertainty. As CFOs work to manage cash flow, perfect accounts receivable, or secure loans and stimulus funding, they need access to reports and metrics that reflect the latest data available.
Grant Thornton’s 2021 International Business Report research highlights the emergence of empathy as a valued leadership trait. The bank used its data lake to feed a real-time dashboard that tracked employee health, which led to better support for employees. Moving into the future with powerful leaders.
This, in turn, has had a positive impact on innovation and decision-making aimed at improving customer services and reporting. . With dashboards powered by CDSW, Bank Mandiri can achieve insights from numerous data sources that streamline banking operations and allow faster customer care. Industry Transformation.
With the volatility of the market and increasing uncertainties that arise within your business, you need actionable insights to contend with competitors buoyed by digital transformation efforts. In other words, you need real-time reporting and deep business insights to provide continuous intelligence for your enterprise.
By building out a dashboard with KPIs and reports feeding from their accounting system, we could help with the craziness of how fast the regulations in the cannabis industry were changing. I could only allocate a small portion of my day to working with the dev shop to build out the dashboard which slowed us down.
Without robust in-house expertise and support to build the necessary dashboards and run queries, many institutions are instead forced to rely on canned reports that can’t be customized. Dashboards that are easy to customize and share across departments allow institutions to tailor their analysis and ask better questions of their data.
Of course the problem is then that Financial Reports (or indeed most Management Reports) are not set up to cope with plus or minus figures, so typically one of £12.4 By the time that people who need to take decisions based on such information are in the loop, the inherent uncertainty of the prediction may have disappeared.
Yardi offers a variety of different tools for reporting; unfortunately, each has its own unique shortcomings. Reporting in Yardi: the Default Options. There are no options for modifying the format of these reports, and in many cases, they may only provide a subset of results.
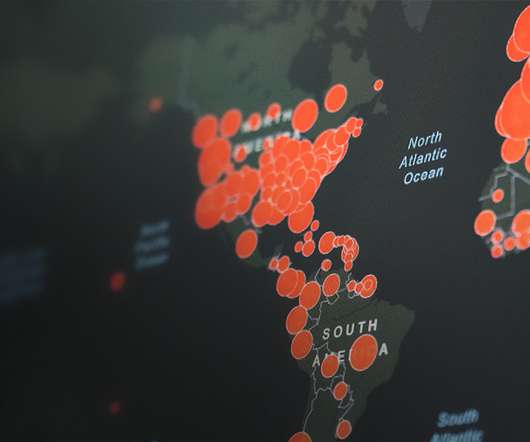
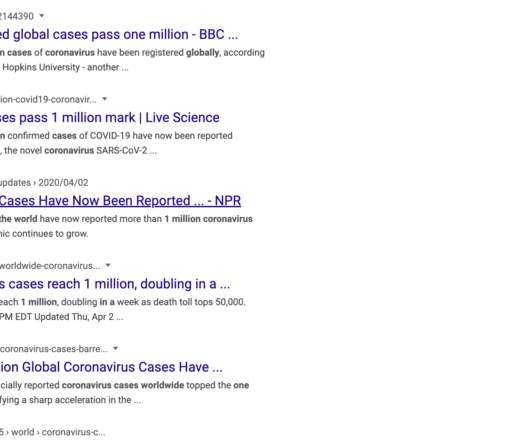
Not to minimize the severity of our situation, but the explosion of numbers, charts, dashboards and data stories is beginning to feel like a pandemic of its own. As things have it, the Johns Hopkins University dashboard quickly became the de facto standard, and as a result gets a billion views a day. ONE BILLION!!
In 2018 it was reported that Irish economic growth was 7.8 report is a great illustration of how Ireland has ridden the waves of economic uncertainty and emerged successfully. Read the Report. Explore the Interactive Dashboard. Here’s what we found. GDP, Air Traffic Data, and Economic Performance. Our GoFigure!
I’ve learned a lot more about Agile processes and software development and thinking about how some of those same practices actually apply when we’re building different analytical applications like dashboards,” Amanda said. Remember that there’s a lot of uncertainty in the data and it’s not uncertainty that we can represent visually well.
AnswerRocket’s exploration paradigm centers around natural language query, dynamic data stories and proactive alerts instead of dashboards. Promise in richer countries that are far along in vaccine distribution and significant uncertainty for poorer countries that lag far behind. AnswerRocket. Here is Qlik’s BI Bake-Off video.
How to Build Useful KPI Dashboards. Some KPIs are too detailed to be reported to top management, and some KPIs are too general for middle managers and supervisors. Leading indicators predict performance whereas lagging indicators report on it. 5 Things Not to do When Choosing a Financial Reporting Tool. Download Now.
Inflation, economic uncertainty, and swiftly-changing regulations significantly impact finance professionals. Using the reporting tools ERPs provide can help streamline workflows and reduce timelines, but they’re often too rigid to offer the tailored reporting capabilities organizations need to answer specific business questions.
Due to the Infrastructure Investment and Jobs Act of 2022 in the United States, nonresidential construction is expected to continue expanding despite expected uncertainty in 2023. According to Oxford Economics’ Future of Construction Report , the construction market is expected to grow by $4.5 trillion worldwide by 2030.
The 2020s have been a decade marked by uncertainty. The uncertainty we’ve faced these past few years doesn’t appear to be going away anytime soon, and businesses need to be able to not only respond quickly to change, but to actively plan for it.
Management gurus have long been advocates of measuring, monitoring, and reporting on the numbers that matter most. In a fast-moving world where virtually every business is struggling to meet customer demand amid supply-chain uncertainty, rapid delivery times are more important than ever. ’ Supply Chain KPI Dashboard.
In most companies, financial reporting consumes an inordinate amount of time and energy. By applying the right technology in the right ways, you can eliminate much of the tedious effort that goes into producing routine reports. Finance in Control with Easy EPM Reporting. Report Automation Saves Time and Money.
What has been made clear is that in times of uncertainty, organizations require effective cash management and cash visibility to help enable corporate strategies. on their Benchmark Report:? The report surveyed 109 members of the SAP community. Pre-built templates and a wizard to quickly build reports. SAPinsider?on
Whether static or interactive dashboards , these creative data visualization examples will serve as an inspiration for any data enthusiast. As a result, you can develop a management report that will enable you to gain the insights you need to make changes that have a positive impact on the business.
The shifting landscape of tax reporting is more complex than ever. As a European organization with US operations, or a US-based company that operates in multiple states, you are now facing an increasing demand for state-by-state provision reporting, rather than the traditional blended rate method.
In addition, they faced an onslaught of claims and initial uncertainty about cost and payments for antibody testing, evolving treatments, and, later, vaccines. The industry was not alone in this push: 75% of CIOs reported increased demand for new digital products services because of COVID, according to Gartner.
What has been made clear is that in times of uncertainty, organizations require effective cash management and cash visibility to help enable corporate strategies. on their Benchmark Report:? The report surveyed 109 members of the SAP community. Pre-built templates and a wizard to quickly build reports. SAPinsider?on
We organize all of the trending information in your field so you don't have to. Join 42,000+ users and stay up to date on the latest articles your peers are reading.
You know about us, now we want to get to know you!
Let's personalize your content
Let's get even more personalized
We recognize your account from another site in our network, please click 'Send Email' below to continue with verifying your account and setting a password.


Let's personalize your content