This site uses cookies to improve your experience. To help us insure we adhere to various privacy regulations, please select your country/region of residence. If you do not select a country, we will assume you are from the United States. Select your Cookie Settings or view our Privacy Policy and Terms of Use.
Cookie Settings
Cookies and similar technologies are used on this website for proper function of the website, for tracking performance analytics and for marketing purposes. We and some of our third-party providers may use cookie data for various purposes. Please review the cookie settings below and choose your preference.
Used for the proper function of the website
Used for monitoring website traffic and interactions
Cookie Settings
Cookies and similar technologies are used on this website for proper function of the website, for tracking performance analytics and for marketing purposes. We and some of our third-party providers may use cookie data for various purposes. Please review the cookie settings below and choose your preference.
Strictly Necessary: Used for the proper function of the website
Performance/Analytics: Used for monitoring website traffic and interactions
Jet Analytics provides users with several data sources and data structures to choose from when building reports or dashboards. Learn skills for leveraging Jet Analytics’ various data environments for ideal reporting performance and outcomes that drive better business decisions. Register Now!
I recently had the opportunity to be a guest on James Pann’s YouTube show to talk about reports. Here’s a recap of our conversation: My Introduction to Dusty Shelf Reports. Early on in my career, I was throwing all my effort into a report, staying late, working on the weekends, doing whatever it took to do my best work.
COVID-19 brought a new urgency to financial reporting, with businesses needing to have an accurate view of their cash flow in order to inform future planning. Alongside this, many businesses implemented dashboards to keep track of key financial KPIs on a more regular basis. The Best of 2020: Dashboards and Key Metrics.
Not only will you be able to design your own reports and dashboards that will show exactly how your cash flow is at that point in time, but you will also be able to drill down for easy data validation. To learn more join us on June 17 for this free 20 minute webinar,“ Cash Flow Analysis: Cash Management Has Never Been So Critical.”
Speaker: Dr. Karen Hardy, CEO and Chief Risk Officer of Strategic Leadership Advisors LLC
However, risk communication involves more than just reporting information and populating dashboards, and we may be limiting our skillset. Communication is a core component of a resilient organization's risk management framework. Storytelling is the ability to express ideas and convey messages to others, including stakeholders.
With advanced analytics, flexible dashboarding and effective data visualization, FP&A storytelling has become both an art and science. You can watch the webinar here (registration required) to learn how to conduct FP&A storytelling in order to enhance fact-based decision making. Real-world storytelling dashboard examples.
The data engineer then emails the BI Team, who refreshes a Tableau dashboard. The delays impact delivery of the reports to senior management, who are responsible for making business decisions based on the dashboard. All the code, Talend job, and the BI report are version controlled using Git.
Now available for European Union businesses, insightsoftware ESG reduces the burden of reporting and enhances an organization’s reputation with stakeholders RALEIGH, N.C. The modular solution simplifies and automates ESG reporting, saving time and improving visibility.
Visualizing data in charts, graphs, dashboards, and infographics is one of the most powerful strategies for getting your numbers out of your spreadsheets and into real-world conversations. Put your easiest-to-follow chart in your final presentation or report. Consultants, this means the report will look like it came from the client.
Webinar Date: 16 September, 2020 1PM – 1:45 PM across various time zones. Hubble integrates all your critical business systems so that users at all levels have access to live data and automated reporting, planning, and budgeting. Web based dashboards for visual analytics. Register Now. Register Now. Register Now.
Is the data in the report I am looking at “fresh”? T ools/Models/Dashboards. Is my dashboard displaying the correct data? How many models and dashboards were deployed? Learn more, watch our on-demand webinar. Click Here To Learn More About DataOps Mission Control In This Recently Recorded Webinar.
Blogs Podcasts Whitepapers and Guides Tools and Calculators Webinars Sample Reports The Evolution of the CFO into the Chief Data Storyteller View Insight Now Our Favorite CFO Blogs The Venture CFO Blog Link: [link] Are you looking for blog posts for CFOs by CFOs? Check out a sample report from our dynamic dashboard solution.
Over a third of respondents to our State of Analytics and BI survey reported that they are currently focused on growing their use of analytics across their businesses. Self-service dashboards: Your insights, your way. Today’s organizations are more data-driven than ever. Additional capabilities.
We can’t just write reports and make pretty slides. Reports and slides aren’t enough anymore… and have never been enough. How do you help them move past just creating the report? The group had put significant effort into developing a (really good) interactive dashboard for their website. What Do You Help Clients With?
You can use data analytics dashboards on your digital advertising platforms to focus on the best converting traffic, such as the PPC keywords that drive the most sales. Many people want to download spreadsheets or reports that have useful data, such as keywords for their own marketing campaigns.
On January 4th I had the pleasure of hosting a webinar. What is unique about the D&A Leadership Vision is that it crossed over into business since for many organizations, the CDO reports into the CEO or COO (as examples). The fill report is here: Leadership Vision for 2021: Data and Analytics. Does this promote efficiency?
For example, NetSuite makes it possible to generate reports on enterprise performance, but it doesn’t necessarily optimize the reporting process. It offers a suite of financial and operational reporting tools that run inside the familiar ecosystem of Excel and fully integrate with NetSuite. Spreadsheet Server does.
I used to write hundred-page reports… I was trained to write lengthy reports filled with statistical jargon. Now, I design reports that people actually want to read. Reports aren’t supposed to feel daunting. Reports aren’t supposed to feel daunting. Fewer paragraphs. More graphs.
Additionally, the website will include a (non-technical) blog about market developments in the Power BI ecosystem and an overview of webinars around the Power BI platform as well as some helpful links. Within the questionnaire, you will find a form to add and promote your webinars and success stories. How is the powerbimap funded?
Join Gregg van der Westhuizen, senior solution engineer, as he takes you through five rounds of easy productivity gains with examples from Procure to Pay and Invoice to Cash: Round 1 – Drill down to a live Account Analysis report in Excel to analyze Oracle EBS subledgers. Round 5 – Deployment of reports to allow for team collaboration.
He has recently attended a Cloudera Fast Forward webinar where the latest trends and production-proven ML algorithms have been highlighted and exemplified. He downloads the Cloudera Fast Forward report about modeling Telco Churn and after reading it, his interest is piqued. Time passes by and the dashboard is getting very popular.
August 11, 2022 – insightsoftware , a global provider of reporting, analytics, and performance management solutions, today announced it has acquired Dundas Data Visualization, Inc. , The Dundas solution is a flexible, end-to-end BI platform that offers software providers the ability to customize dashboards, reports, and visualizations.
Some of these new features are: Prometheus endpoint : NiFi now exposes an endpoint allowing Prometheus to collect monitoring data about NiFi instances and running flows and giving you the ability to create very custom dashboards. and define a sink for where the data should go (Kafka, Site to Site, Prometheus, a database, etc.).
Dashboards showing ever-increasing levels of information are more and more in demand, but perhaps less and less understood. Sometimes a dashboard is a critical piece of software enabling near-instantaneous responses to extinction-level business catastrophes. What’s a dashboard good for? And what for? talking to humans.
Jet Basics is a free reporting tool available with Microsoft Dynamics. Offered as an extension included with Dynamics NAV since 2011 and Dynamics GP since 2016, Jet Basics gives users a simple way to create basic reports and business queries inside of Excel. It is also not designed to manage complex data.
Recognizing a need for better operational analytics, insightsoftware leveraged award-winning technology from Logi Analytics to provide Oracle ERP Cloud users the ability to customize, create, and share interactive dashboards and reports across all departments of a business.
The full webinar is available on-demand and contains even more tips, implementation guidance, and future plans for AI from these companies. See the dashboards that Eric Wright FM uses to differentiate its services: >>Watch the the full on-demand webinar. Watch Webinar. Watch Webinar.
Since that launch, we’ve worked tirelessly to deliver best-in-class data visualization, dashboarding, and predictive applications capabilities across our cloud and on-premises infrastructures through Cloudera’s machine learning and data warehousing products — all without additional costs, moving data or purchasing any third-party tooling.
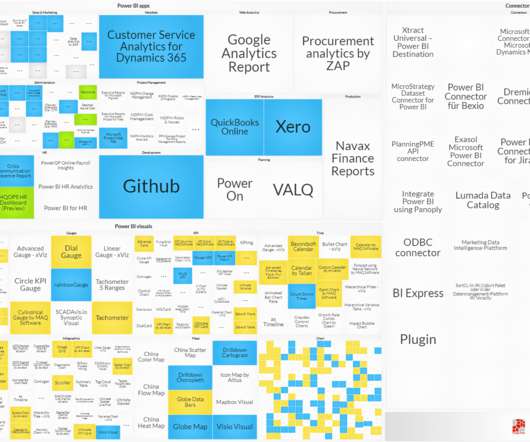
Whether you are using the free desktop version or the paid professional version, one of the biggest challenges with Power BI is customizing your dashboards and reports to fit your analytical requirements. When creating or editing a Power BI dashboard, you have access to a ton of different types of visuals.
Roy Schulte, Research Vice President and Distinguished Analyst at Gartner gave an interesting webinar titled, “ Decision Management: What It Is and Why You Need It.” This data is stored and represented in the decision dashboard, and can be used to retrain models and update rules, over time. February 20 th , 2019 W.
Model risk management is used to identify, manage, monitor and report on risk and compliance initiatives at scale. Dynamic dashboards provide clear, concise customizable results that enable a robust set of workflows, enhanced collaboration and helps to drive business compliance across multiple regions and geographies.
I first came across Ann’s work when our company signed a few of us up for a dashboardwebinar. Additionally, when I reported the stats for this project, I had them all on one slide with some grainy photos off the internet. And WOW did she have some great design tips and tricks! It wasn’t horrible, but it wasn’t great either.
All four agencies had reported an independent but identical experience with data governance in the past. See: Webinar Effective Data and Analytics Governance – Finally! While firms can now be effective with operational data governance in business application (see webinar Effective Data and Analytics Governance – Finally!
Mix of ad hoc exploration, dashboarding, and alert monitoring. Ad hoc exploration and scheduled reports. These are end-to-end, high volume applications that are used for general purpose data processing, Business Intelligence, operational reporting, dashboarding, and ad hoc exploration. 200,000 queries per day.
For the last 4 years, we have held bi-weekly BusinessObjects webinars which are often first presented at IBIS and cover the topics that are most important to you. Web Intelligence, IDT Universe Design, BusinessObjects administration, Dashboard design and data visualization. The InfoSol 2020 Dashboard Awards. IDT in a Day.
It doesn’t have so many templates for other uses, it only has social media, presentation, report, poster and flyers design. Introduction: FineReport is a powerful BI reporting and dashboard software. Introduction: Visme offers a large amount of learning tutorials, which consists of blogs, videos, ebooks and online webinars.
With the help of visually appealing dashboards and reports, evaluating the actuals is simple and straightforward. In sales, the quality and frequency of forecasts can be increased and the effort required for planning, budgeting, and reporting is often reduced. But placing strategic and financial guidance is still a pain.
To tackle this last-mile issue, we released CDP Data Visualization — An easy to use, self-service dashboarding and intelligent reporting tool included with CDP Machine Learning out of the box. . Explainable, predictive reporting with CDP Data Visualization.
Limited self-service reporting across the enterprise. The goal in addressing these pain points is to empower your stakeholders (both within Finance/FP&A and your business partners) to be able to deliver: Consistent reporting and dashboards. Self-service reporting. Exception reporting. Data accuracy concerns.
Increased accuracy and consistency of reports and dashboards leading to improved decisions, fewer expensive errors based on poor or inconsistent data, and reduced rework from these errors. Reduced duplication of data, numbers of system interfaces and manual data entry processes. Reduced compliance issues.
A new addition to the Control Center, Projects Portfolio Dashboard, allows data science leaders to easily track and manage projects with a holistic understanding of the latest developments. Project Portfolio Dashboard. All of this information powers Domino’s new Projects Portfolio Dashboard. License Usage Reporting .
Need to create an operational or paginated report that you will often need to export to Excel? Tableau does not have a paginated report capability and PowerBI’s answer with Report Builder, which is a totally different tool to PowerBI and is a port of their old SSRS tool, is like taking a huge step backwards.
Don’t rely too heavily on dashboard data: Learning data is most useful when it’s analyzed, embraced, and acted upon (ideally by being infused into user workflows when and where it’s most relevant). Insights creates AI-powered dashboards built specifically for learning data analysis.
Combined, Amir said, we can make it possible to go beyond the dashboard and create AI-powered analytics apps where users can take immediate action on their insights. In addition, you will see a significant improvement in dashboard performance.
We organize all of the trending information in your field so you don't have to. Join 42,000+ users and stay up to date on the latest articles your peers are reading.
You know about us, now we want to get to know you!
Let's personalize your content
Let's get even more personalized
We recognize your account from another site in our network, please click 'Send Email' below to continue with verifying your account and setting a password.


Let's personalize your content