This site uses cookies to improve your experience. To help us insure we adhere to various privacy regulations, please select your country/region of residence. If you do not select a country, we will assume you are from the United States. Select your Cookie Settings or view our Privacy Policy and Terms of Use.
Cookie Settings
Cookies and similar technologies are used on this website for proper function of the website, for tracking performance analytics and for marketing purposes. We and some of our third-party providers may use cookie data for various purposes. Please review the cookie settings below and choose your preference.
Used for the proper function of the website
Used for monitoring website traffic and interactions
Cookie Settings
Cookies and similar technologies are used on this website for proper function of the website, for tracking performance analytics and for marketing purposes. We and some of our third-party providers may use cookie data for various purposes. Please review the cookie settings below and choose your preference.
Strictly Necessary: Used for the proper function of the website
Performance/Analytics: Used for monitoring website traffic and interactions
This is where the power of business dashboards comes into play. Dashboards often are the best way to gain insight into an organization and its various departments, operations and performance. Well-built, focused dashboards easily serve up summaries and reports of the BI that’s most critical to the organization.
That said, if you’re looking to evolve your empire, increase brand awareness, and boost your bottom line, embracing business performance dashboards and big data should be at the top of your priority list. If you fail to do so, you risk damages in your productivity and costs. What Is A Performance Dashboard In Business?
Soon businesses of all sizes will have so much amount of information that dashboard software will be the most invaluable resource a company can have. That’s why we welcome you to the world of interactive dashboards. Your Chance: Want to test interactive dashboard software for free? What Is An Interactive Dashboard?
If you want to convey crucial information to decision-makers in the easiest and most effective way possible, you need to embrace the power of interactive dashboards. A business dashboard offers at-a-glance insights based on key performance indicators (KPIs) and is an intuitive and visually pleasing way to consume data.
Speaker: Dr. Karen Hardy, CEO and Chief Risk Officer of Strategic Leadership Advisors LLC
Communication is a core component of a resilient organization's risk management framework. However, risk communication involves more than just reporting information and populating dashboards, and we may be limiting our skillset. Storytelling is the ability to express ideas and convey messages to others, including stakeholders.
The importance of this finance dashboard lays within the fact that every finance manager can easily track and measure the whole financial overview of a specific company while gaining insights into the most valuable KPIs and metrics. SaaS management dashboard. click to enlarge**. Explore our 14-day free trial. click to enlarge**.
This often resulted in lengthy manual assessments, which only increased the risk of human error.” The decision to start in a controlled environment and gradually expand AI capabilities allowed Camelot the time to mitigate risks and hone Myrddin before its rollout in September 2024. Myrddin uses AI to interact intelligently with users.
As IT landscapes and software delivery processes evolve, the risk of inadvertently creating new vulnerabilities increases. These risks are particularly critical for financial services institutions, which are now under greater scrutiny with the Digital Operational Resilience Act ( DORA ).
This is precisely why Microsoft Dynamics 365 integration with BI dashboards has become a game-changer. But when BI dashboards are seamlessly linked, organizations can: Monitor business health in real-time : When BI dashboards are fully integrated, businesses can move beyond relying on outdated, end-of-month reports. Whats Next?
Spreadsheets finally took a backseat to actionable and insightful data visualizations and interactive business dashboards. Predictive analytics indicates what might happen in the future with an acceptable level of reliability, including a few alternative scenarios and risk assessment. Data exploded and became big.
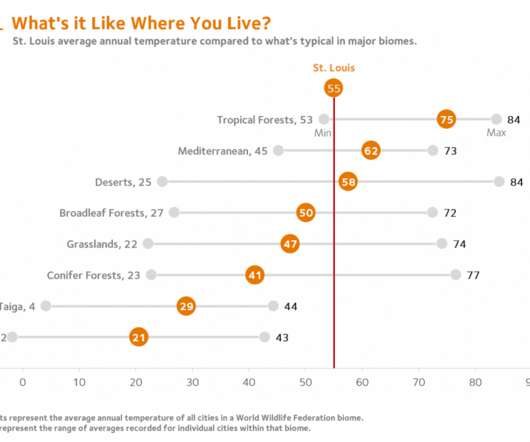
For the past few months, I’ve been developing dashboards to support students’ understanding of local ecology and equip them to use that local understanding as a baseline to explore the rest of the world. Graphs showing means (or even means of means) risks becoming too abstract without the right supports. Keep up the great work Bob! –
Just as state urban development offices monitor the health of different cities and provide targeted guidance based on each citys unique challenges, our portfolio health dashboard offers a comprehensive view that helps guide different business units toward optimal outcomes. Shawn McCarthy 3.
What type of dashboard do we need for our project? I want to talk about something that’s a little controversial in the dashboard space: There are 4 types of dashboards, all of which are correct. Here’s a 12-minute video to help you narrow down which type(s) of dashboard you need for your next project.
T ools/Models/Dashboards. Is my dashboard displaying the correct data? How many models and dashboards were deployed? How do other organizations solve this risk problem? The biggest risk of all is space flight. How do SpaceX and NASA manage risk? Did every job that was supposed to run, actually run?
Knowing your risk level as you navigate a large venue can help you avoid crowds and stay safely within your bubble – all of which empowers you to enjoy the experience all the more. Live at Eurovision: a Bluetooth App to Navigate Covid Risk. A New Normal: Bubble-Up for Safety at Live Events with Flockey. So, how does it work?
The primary goal for Eddingfield and his team was to improve change management processes and reduce the risk of failed changes by implementing collision detection and impact analysis. The insurance company decided to migrate from on-premises BMC Remedy to cloud-based BMC Helix ITSM and Discovery.
A host of business intelligence concepts are executed through intuitive, interactive tools and dashboards – a centralized space that provides the ability to drill down into your data with ease. The fact is, without business intelligence, you risk the very real possibility of drowning in data. Data dashboarding and reporting.
Finally, we will show how to combine those metrics with the help of modern KPI software and create professional supply chain dashboards. For example, if your transportation costs are high and you decide to push the speed and weight of trucks, you can risk accidents and potentially detrimental consequences for your business.
You may run different types of analytics, from dashboards and visualizations to big data processing, real-time analytics, and machine […]. Introduction A data lake is a central data repository that allows us to store all of our structured and unstructured data on a large scale.
After the 2008 financial crisis, the Federal Reserve issued a new set of guidelines governing models— SR 11-7 : Guidance on Model Risk Management. Note that the emphasis of SR 11-7 is on risk management.). Sources of model risk. Machine learning developers are beginning to look at an even broader set of risk factors.
While traditional reports often include a summary, body, and conclusion in a written format, this post will focus on interactive monthly reports created with a professional dashboard creator. All these reports were carefully created with an intuitive BI dashboard software. Our next example is a dashboard focusing on retention metrics.
In the matter, data analysis and dashboard designer software is a precious ally. We will finish by presenting a business dashboard that will show how those metrics work together when depicting an inventory data-story. Inventory Metrics Examples On Dynamic Dashboards. a) Inventory analytics dashboard for supply chain.
By implementing a robust snapshot strategy, you can mitigate risks associated with data loss, streamline disaster recovery processes and maintain compliance with data management best practices. Navigate to the OpenSearch Dashboard’s endpoint connected with your OpenSearch Service domain. curl -XGET _cat/indices?
At the same time, meaningful dashboards should be developed based on the defined metrics to obtain funding and support targeted reporting to relevant committees. Only in this way can risks be minimized and the highest compliance standards guaranteed.
To ensure the stability of the US financial system, the implementation of advanced liquidity risk models and stress testing using (MI/AI) could potentially serve as a protective measure. To improve the way they model and manage risk, institutions must modernize their data management and data governance practices.
Turning these datasets into a business dashboard can effectively track the right values and offer a comprehensive application to the entire business system. This kind of ad hoc analysis will tell you whether you risk customer complaints if they never received their package, or if you need to push up your supply chain game.
While using a business dashboard, all your information can be simplified into a single place, making the time for meaningful decisions much faster. In a business context, this method identifies patterns and trends and can forecast inventory, predict customer responses to new products, assess risks, among others.
Instead, they rely on up-to-date dashboards that help them visualize data insights to make informed decisions quickly. Manually handling repetitive daily tasks at scale poses risks like delayed insights, miscataloged outputs, or broken dashboards. At a large volume, it would require around-the-clock staffing, straining budgets.
Fragmented systems, inconsistent definitions, legacy infrastructure and manual workarounds introduce critical risks. The decisions you make, the strategies you implement and the growth of your organizations are all at risk if data quality is not addressed urgently. Manual entries also introduce significant risks.
Reference ) Security information and event management (SIEM) on the Splunk platform is enhanced with end-to-end visibility and platform extensibility, with machine learning and automation (AIOps), with risk-based alerting, and with Federated Search (i.e., Splunk Cloud Platform Dashboard. The new Splunk Enterprise 9.0 Source: [link].
Using the right dashboard and data visualizations, it’s possible to hone in on any trends or patterns that uncover inefficiencies within your processes. In other words, UPS found that turning into oncoming traffic was causing a lot of delays, wasted fuel, and increased safety risk. Now’s the time to strike.
It’s necessary to say that these processes are recurrent and require continuous evolution of reports, online data visualization , dashboards, and new functionalities to adapt current processes and develop new ones. Understand the expected information delivery avenues: reports, dashboards, ad hoc reporting , etc. Accept change.
With the emergence of GenAI capabilities, fast-tracking digital transformation deployments are likely to change manufacturing as we know it, creating an expanding chasm of leaders versus followers, the latter of which will risk obsolescence. However, despite the benefits of GenAI, there are some areas of risk. Bias and fairness.
6) The Use of Dashboards For Data Interpretation. Business dashboards are the digital age tools for big data. Through the art of streamlined visual communication, data dashboards permit businesses to engage in real-time and informed decision-making and are key instruments in data interpretation. 2) How To Interpret Data?
Poor-quality data or the mishandling of data can leave businesses at risk of monumental failure. White labeling and embedding analytics tools and methodologies enhance interpretive capabilities, solve targeted challenges, address risks, and offer personalized real-time analytical solutions through smart modern real-time dashboard tools.
Solid reporting provides transparent, consistent and combined HR metrics essential for strategic planning, risk management and the management of HR measures. A proven means of effectively presenting the complex key figures, measures and risks of a personnel plan is the use of index barometer dashboards, which offer intuitive visualization.
The purpose is not to track every statistic possible, as you risk being drowned in data and losing focus. Using an IT analytics software is extremely useful in the matter: by gathering all your data in a single point-of-truth, you can easily analyze everything at once and create actionable IT dashboards.
Improved risk management: Another great benefit from implementing a strategy for BI is risk management. For instance, BI dashboard software such as datapine offers the possibility to generate interactive dashboards in real-time without the need for any technical knowledge. click to enlarge**. Pursue a phased approach.
Amazon Redshift features like streaming ingestion, Amazon Aurora zero-ETL integration , and data sharing with AWS Data Exchange enable near-real-time processing for trade reporting, risk management, and trade optimization. You can run a direct query from QuickSight for BI reporting and dashboards.
In addition, we will see how online dashboards have overthrown the static nature of classic reports and given way to a much faster, more interactive way of working with data. Here we will cover 15 useful dashboard examples from different industries and functions to put the value of dashboard reporting into perspective.
However, people generally don’t know which graphs, charts, or visualizations to ask for or how to discover initial data to prepare data for their dashboards. This raises the serious risk that an LLM could reveal sensitive proprietary business information.
To help you get started with the topic, we put together this insightful guide on modern performance reporting using professional online dashboards. By being able to make informed decisions, you’ll ensure your goals are being met with less financial risk, thanks to smart resource allocation. What Is A Performance Report?
NS1 Dedicated DNS provides the peace of mind you need to keep the lights on even when all your dashboards are flashing red. Learn more about NS1 Dedicated DNS The post How to mitigate the risks of DIY authoritative DNS appeared first on IBM Blog.
As more businesses use AI systems and the technology continues to mature and change, improper use could expose a company to significant financial, operational, regulatory and reputational risks. It encompasses risk management and regulatory compliance and guides how AI is managed within an organization.
We organize all of the trending information in your field so you don't have to. Join 42,000+ users and stay up to date on the latest articles your peers are reading.
You know about us, now we want to get to know you!
Let's personalize your content
Let's get even more personalized
We recognize your account from another site in our network, please click 'Send Email' below to continue with verifying your account and setting a password.


Let's personalize your content