This site uses cookies to improve your experience. To help us insure we adhere to various privacy regulations, please select your country/region of residence. If you do not select a country, we will assume you are from the United States. Select your Cookie Settings or view our Privacy Policy and Terms of Use.
Cookie Settings
Cookies and similar technologies are used on this website for proper function of the website, for tracking performance analytics and for marketing purposes. We and some of our third-party providers may use cookie data for various purposes. Please review the cookie settings below and choose your preference.
Used for the proper function of the website
Used for monitoring website traffic and interactions
Cookie Settings
Cookies and similar technologies are used on this website for proper function of the website, for tracking performance analytics and for marketing purposes. We and some of our third-party providers may use cookie data for various purposes. Please review the cookie settings below and choose your preference.
Strictly Necessary: Used for the proper function of the website
Performance/Analytics: Used for monitoring website traffic and interactions
“It is a capital mistake to theorize before one has data.”– Data is all around us. Data has changed our lives in many ways, helping to improve the processes, initiatives, and innovations of organizations across sectors through the power of insight. Let’s kick things off by asking the question: what is a data dashboard?
Dataanalytics is the backbone in many modern organizations. Companies need to analyze data to optimize their business models in a variety of ways. They have found that big data has changed their business models in countless ways. DataAnalytics Can Be Invaluable for Creating Dedicated Team Models.
Data exploded and became big. Spreadsheets finally took a backseat to actionable and insightful data visualizations and interactive business dashboards. The rise of self-service analytics democratized the data product chain. Suddenly advanced analytics wasn’t just for the analysts.
A CRM dashboard is a centralized hub of information that presents customer relationship management data in a way that is dynamic, interactive, and offers access to a wealth of insights that can improve your consumer-facing strategies and communications. Let’s look at this in more detail. What Is A CRM Report? Follow-Up Contact Rate.
In recent years, analytical reporting has evolved into one of the world’s most important business intelligence components, compelling companies to adapt their strategies based on powerful data-driven insights. Your Chance: Want to build your own analytical reports completely free?
“Without big dataanalytics, companies are blind and deaf, wandering out onto the web like deer on a freeway.” – Geoffrey Moore. And, as a business, if you use your data wisely, you stand to reap great rewards. Data brings a wealth of invaluable insights that could significantly boost the growth and evolution of your business.
Big data plays a crucial role in online data analysis , business information, and intelligent reporting. Companies must adjust to the ambiguity of data, and act accordingly. Business intelligence reporting, or BI reporting, is the process of gathering data by utilizing different software and tools to extract relevant insights.
We have talked about a number of the ways that business leaders are investing in big data technology and analytics. The market for talent analytics is projected to be worth $1.8 Big dataanalytics can help firms save money. Talent analytics is the use of big data for HR functions.
In our data-rich age, understanding how to analyze and extract true meaning from the digital insights available to our business is one of the primary drivers of success. Despite the colossal volume of data we create every day, a mere 0.5% is actually analyzed and used for data discovery , improvement, and intelligence.
In our cutthroat digital age, the importance of setting the right data analysis questions can define the overall success of a business. That being said, it seems like we’re in the midst of a data analysis crisis. Your Chance: Want to perform advanced data analysis with a few clicks?
Decision making is a big part of running a business, and in today’s world, big data drives that decision making. The power of big data has become more available than ever before. Big data has been highly beneficial to business. Data is one of the most important resources for any business. Understand Your Business.
Big data has been incredibly important in the marketing profession. Marketers need to rely heavily on big data technology to reach customers more effectively. Big data technology isn’t just important for making better insights. Visual marketing dashboards are prime examples of using big data effectively in marketing.
How to measure your dataanalytics team? So it’s Monday, and you lead a dataanalytics team of perhaps 30 people. And she is numbers driven – great! Like most leaders of dataanalytic teams, you have been doing very little to quantify your team’s success. Introduction. You’ve got a new boss.
Agile analytics (or agile business intelligence) is a term used to describe software development methodologies used in BI and analytical processes in order to establish flexibility, improve functionality, and adapt to new business demands in BI and analytical projects. Identify key business requirements and needs.
They may gather financial, marketing and sales-related information, or more technical data; a business report sample will be your all-time assistance to adjust purchasing plans, staffing schedules, and more generally, communicating your ideas in the business environment. Let’s get started. Explore our 14-day free trial.
However, computerization in the digital age creates massive volumes of data, which has resulted in the formation of several industries, all of which rely on data and its ever-increasing relevance. Dataanalytics and visualization help with many such use cases. It is the time of big data. What Is DataAnalytics?
Concerning professional growth, development, and evolution, using data-driven insights to formulate actionable strategies and implement valuable initiatives is essential. Data visualization methods refer to the creation of graphical representations of information. That’s where data visualization comes in.
Using business intelligence and analytics effectively is the crucial difference between companies that succeed and companies that fail in the modern environment. The main use of business intelligence is to help business units, managers, top executives, and other operational workers make better-informed decisions backed up with accurate data.
As digital transformation evolves, and more businesses begin to harness the power of digital technologies, the rate at which we are creating data is rising by the second. As such, we have to find approaches to dataanalytics and business intelligence. Download our executive, pocket-sized guide to real time BI and analytics!
Stream processing frameworks such as Apache Flink empower users to design systems that can ingest and process continuous flows of data at scale. 2022 , with Apache Flink, and provide a working example that will help you get started on a managed Apache Flink solution using Amazon Kinesis DataAnalytics.
In a data-driven age, modern organizations need access to advanced dataanalytics solutions to help them improve the business in a wealth of key areas—Salesforce is one of those solutions. First, let’s take a moment to understand the role of Salesforce reports in the business world. 1) Define your goals.
More companies are turning to dataanalytics technology to improve efficiency, meet new milestones and gain a competitive edge in an increasingly globalized economy. One of the many ways that dataanalytics is shaping the business world has been with advances in business intelligence. In a fast-paced, data-rich world.
The industrial manufacturing industry produces unprecedented amounts of data, which is increasing at an exponential rate. Worldwide data is expected to hit 175 zettabytes (ZB) ?by by 2025, and 90 ZB of this data will be from IoT devices. Managing this increasing amount of data can wreak havoc on your financial teams.
There is no disputing that dataanalytics is a huge gamechanger for companies all over the world. Global businesses are projected to spend over $684 billion on big data by 2030. There are many ways that companies are using big data to boost their profitability. Performance Evaluation.
“BI is about providing the right data at the right time to the right people so that they can take the right decisions” – Nic Smith. Dataanalytics isn’t just for the Big Guys anymore; it’s accessible to ventures, organizations, and businesses of all shapes, sizes, and sectors.
Topping the list of executive priorities for 2023—a year heralded by escalating economic woes and climate risks—is the need for datadriven insights to propel efficiency, resiliency, and other key initiatives. Many companies have been experimenting with advanced analytics and artificial intelligence (AI) to fill this need.
What Is Data Intelligence? Data Intelligence is the analysis of multifaceted data to be used by companies to improve products and services offered and better support investments and business strategies in place. Data intelligence can encompass both internal and external business data and information. Healthcare.
Without big dataanalytics, companies are blind and deaf, wandering out onto the Web like deer on a freeway. We are indeed living in a time rich in invaluable digital data. Companies that use dataanalytics are five times more likely to make faster decisions, based on a survey conducted by Bain & Company.
Studies suggest that businesses that adopt a data-driven marketing strategy are likely to gain an edge over the competition and in turn, increase profitability. In fact, according to eMarketer, 40% of executives surveyed in a study focused on data-driven marketing, expect to “significantly increase” revenue. Still unsure?
Over the past 5 years, big data and BI became more than just data science buzzwords. Without real-time insight into their data, businesses remain reactive, miss strategic growth opportunities, lose their competitive edge, fail to take advantage of cost savings options, don’t ensure customer satisfaction… the list goes on.
Most organizations have come to understand the importance of being data-driven. To compete in a digital economy, it’s essential to base decisions and actions on accurate data, both real-time and historical. But the sheer volume of the world’s data is expected to nearly triple between 2020 and 2025 to a whopping 180 zettabytes.
Regardless of where organizations are in their digital transformation, CIOs must provide their board of directors, executive committees, and employees definitions of successful outcomes and measurable keyperformanceindicators (KPIs). Efficiency metrics might show the impacts of automation and data-driven decision-making.
Does data excite, inspire, or even amaze you? Moreover, companies that use BI analytics are five times more likely to make swifter, more informed decisions. With analytical and business intelligence competencies, you can also choose to work with specific types of firms or companies operating within a particular niche or industry.
Exclusive Bonus Content: Ready to use dataanalytics in your restaurant? Get our free bite-sized summary for increasing your profits through data! By managing your information with data analysis tools , you stand to sharpen your competitive edge, increase your profitability, boost profit margins, and grow your customer base.
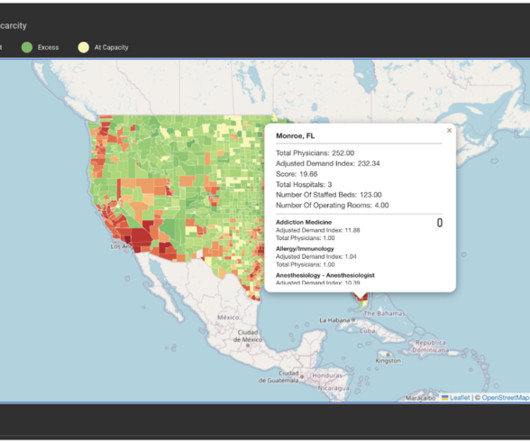
Challenging the Status Quo with Data Insights Historically, Caliber, like many organizations, relied heavily on Microsoft Excel for data management and analysis. Informed Decision-Making: The visual data representation aids in making strategic decisions about resource distribution, service offerings, and partnerships.
If all you kept track of was customer lifetime value and customer acquisition cost, you could see a lot of important data about your business. With a host of interactive sales graphs and specialized charts, this sales graph template is a shining example of how to present sales data for your business. click to enlarge**.
Business analysts (BAs) are responsible for bridging the gap between IT and the business using dataanalytics to assess processes, determine requirements, and deliver data-driven recommendations and reports to executives and stakeholders. Washington, D.C.,
Dataanalytics technology is becoming a more important aspect of business models in all industries. They need to leverage analytics strategically to maximize their revenue. DataAnalytics is an Invaluable Part of SaaS Revenue Optimization. This is an area where analytics can be highly valuable.
This has driven many companies to find more innovative ecommerce marketing models that rely on big data. Using big data and analytics, retailers can more easily optimize their supply chains. Big data helps with this by enabling you to manage deliveries in real time, which is key to supply chain management.
Organizations with legacy, on-premises, near-real-time analytics solutions typically rely on self-managed relational databases as their data store for analytics workloads. Near-real-time streaming analytics captures the value of operational data and metrics to provide new insights to create business opportunities.
Hospitality organizations use dataanalytics to unlock insights, improve operations, and maximize profits. Leveraging analytics enables companies in this space to achieve financial and operational efficiencies while delivering personalized services and offerings. What is dataanalytics in the hospitality industry?
Digital transformation became a key strategic initiative in the mid-2010s, as mobile communications, cloud, dataanalytics, and other advanced information technologies took off, enabling businesses and consumers to easily engage via digital channels. Next, “Horizon 2 is about innovating business models.
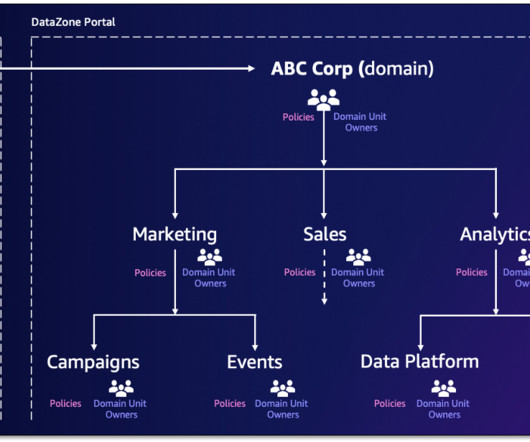
Amazon DataZone has announced a set of new data governance capabilities—domain units and authorization policies—that enable you to create business unit-level or team-level organization and manage policies according to your business needs. Organizations can adopt different approaches when defining and structuring domains and domain units.
The Salesforce Trust Intelligence Platform (TIP) log platform team is responsible for data pipeline and data lake infrastructure, providing log ingestion, normalization, persistence, search, and detection capability to ensure Salesforce is safe from threat actors. This is the bronze layer of the TIP data lake.
We organize all of the trending information in your field so you don't have to. Join 42,000+ users and stay up to date on the latest articles your peers are reading.
You know about us, now we want to get to know you!
Let's personalize your content
Let's get even more personalized
We recognize your account from another site in our network, please click 'Send Email' below to continue with verifying your account and setting a password.


Let's personalize your content